Bullish Bitcoin Chart Pattern Still Intact Despite 7% Price Drop
Bitcoin has erased more than 45 percent of last week's rally, but a bullish chart pattern is still valid. Source
Read More
Cryptocurrency Analysis and News Portal

Bitcoin has erased more than 45 percent of last week's rally, but a bullish chart pattern is still valid. Source
Read More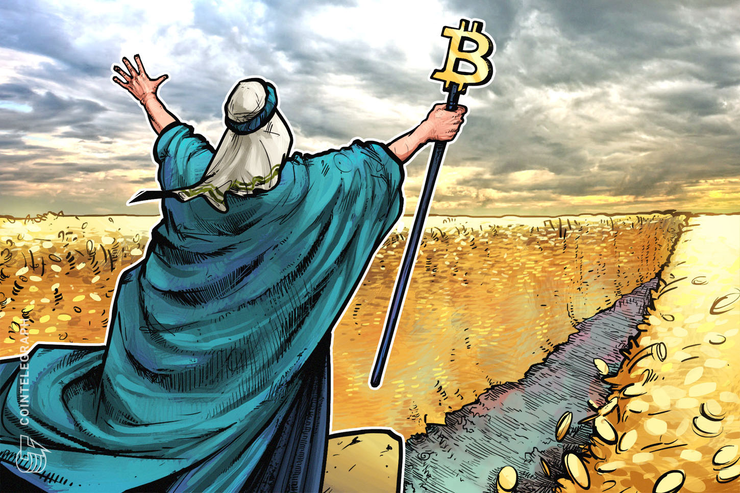
After a massive 42% price spike starting on Oct. 25, Bitcoin (BTC) looks like it has settled into a new range, at least for the time being.Sitting near $9,460 at press time, the future looks brighter for Bitcoin compared to when its price floated around $7,500, as long as
Read More
Since Bitcoin’s (BTC) creation in 2009, the digital asset has undergone a halving event every four years, cutting the number of coins constantly entering the ecosystem in half, making it a deflationary asset. Based on its hard-coded scarcity, and in line with its halvings, Bitcoin has risen dramatically in price
Read More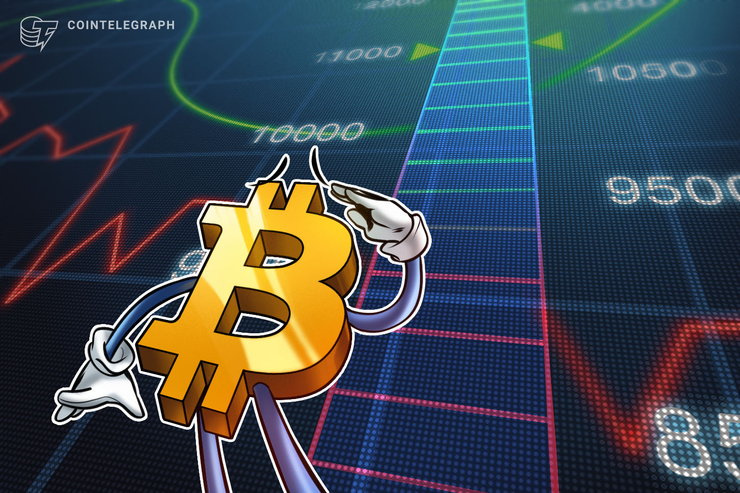
Bitcoin (BTC) held above $9,000 on Oct. 28 as a weekend of bullish madness continued to captivate markets.Cryptocurrency market daily overview. Source: Coin360Bitcoin price mulls next move amid $8.8K warningData from Coin360 showed volatility remaining elevated for Bitcoin on Monday, with swings between $9,100 and $9,900 characterizing the past
Read More
The Current Market SituationAs of October 4th, crypto markets are still struggling to recover. Since its last sharp drop, BTC fails to retrace to $8500 level while many other currencies see significant losses. As of publishing time, BTC dominance remains around 67%. BTC/USDT Daily ChartOn the chart, we can see that
Read More
During periods of times when assets consolidate and price action becomes exceptionally confusing, some crypto analysts will occasionally flip their Bitcoin price charts upside down in an to attempt to remove any preconceived bias from their technical analysis.One prominent crypto analyst has done just that, and Bitcoin’s current price action
Read More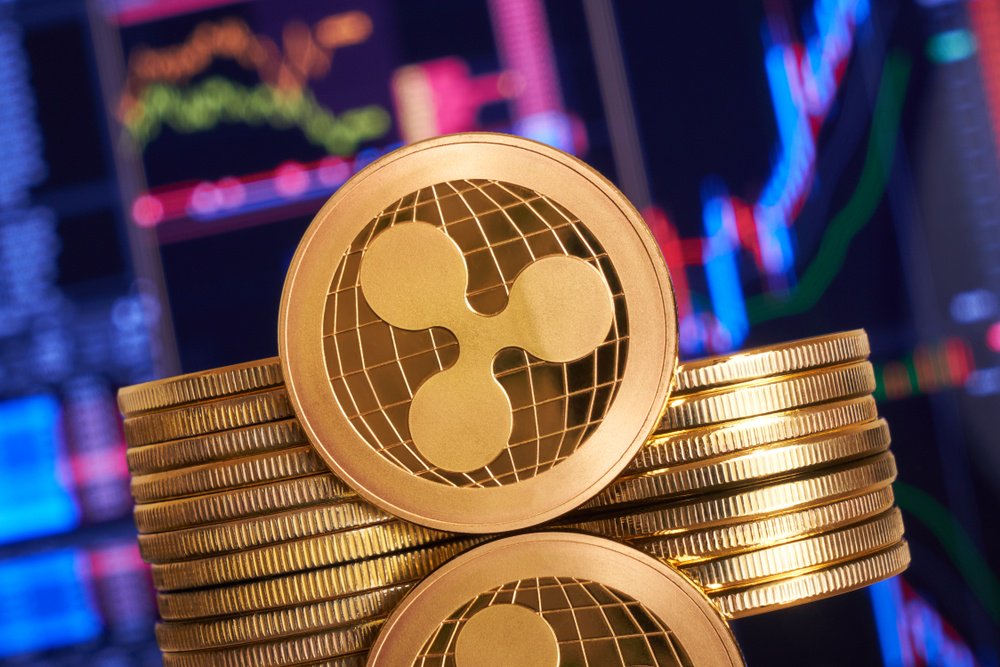
The Ripple price is a screaming buy, according to market analyst Naeem Aslam. But should investors tread with caution when it comes to XRP? | Source: ShutterstockBy CCN Markets: Since late June when the Ripple (XRP) price reached its 2019 high near $0.50, the cryptocurrency has plummeted nearly 50
Read More