
Inflation came down a lot faster than most investors and analysts anticipated, reaching 3% in June. The recession that most analysts predicted is nowhere to be seen, according to the 3.6% unemployment rate nearing a 50-year low and the S&P 500 Index showing a 19% gain year-to-date.
While the current market performance may lead investors to believe that a recession has been avoided, there are three metrics that have been able to consistently predict recessions over time. These leading economic indicators are key economic variables that tend to move ahead of changes in overall economic activity, providing an early warning system for changes in the business cycle. Let’s dig into three of these indicators and explain how investors can interpret them.
Yield curve inversion
The yield curve represents the relationship between short-term and long-term interest rates on government bonds. Normally, long-term bonds have higher yields than short-term bonds to compensate investors for the risk of holding their money for a more extended period.
Historically, an inverted yield curve has often preceded recessions. This indicator suggests that investors are worried about the near future and expect interest rates to fall due to a potential economic slowdown.
The two-year Treasury yield is currently 3.25%, while the 10-year Treasury yield is 2.95%, typical of periods ahead of a recession. However, that has been the case since September 2022, and historically there’s a nine- to 24-month lag before the economic contraction takes place.
Leading economic indicators (LEI)
The Conference Board, a nonprofit research organization, compiles a set of economic indicators known as the leading economic indicators (LEI). These indicators include a variety of data points, such as building permits, stock prices, consumer expectations, average weekly hours worked and more.
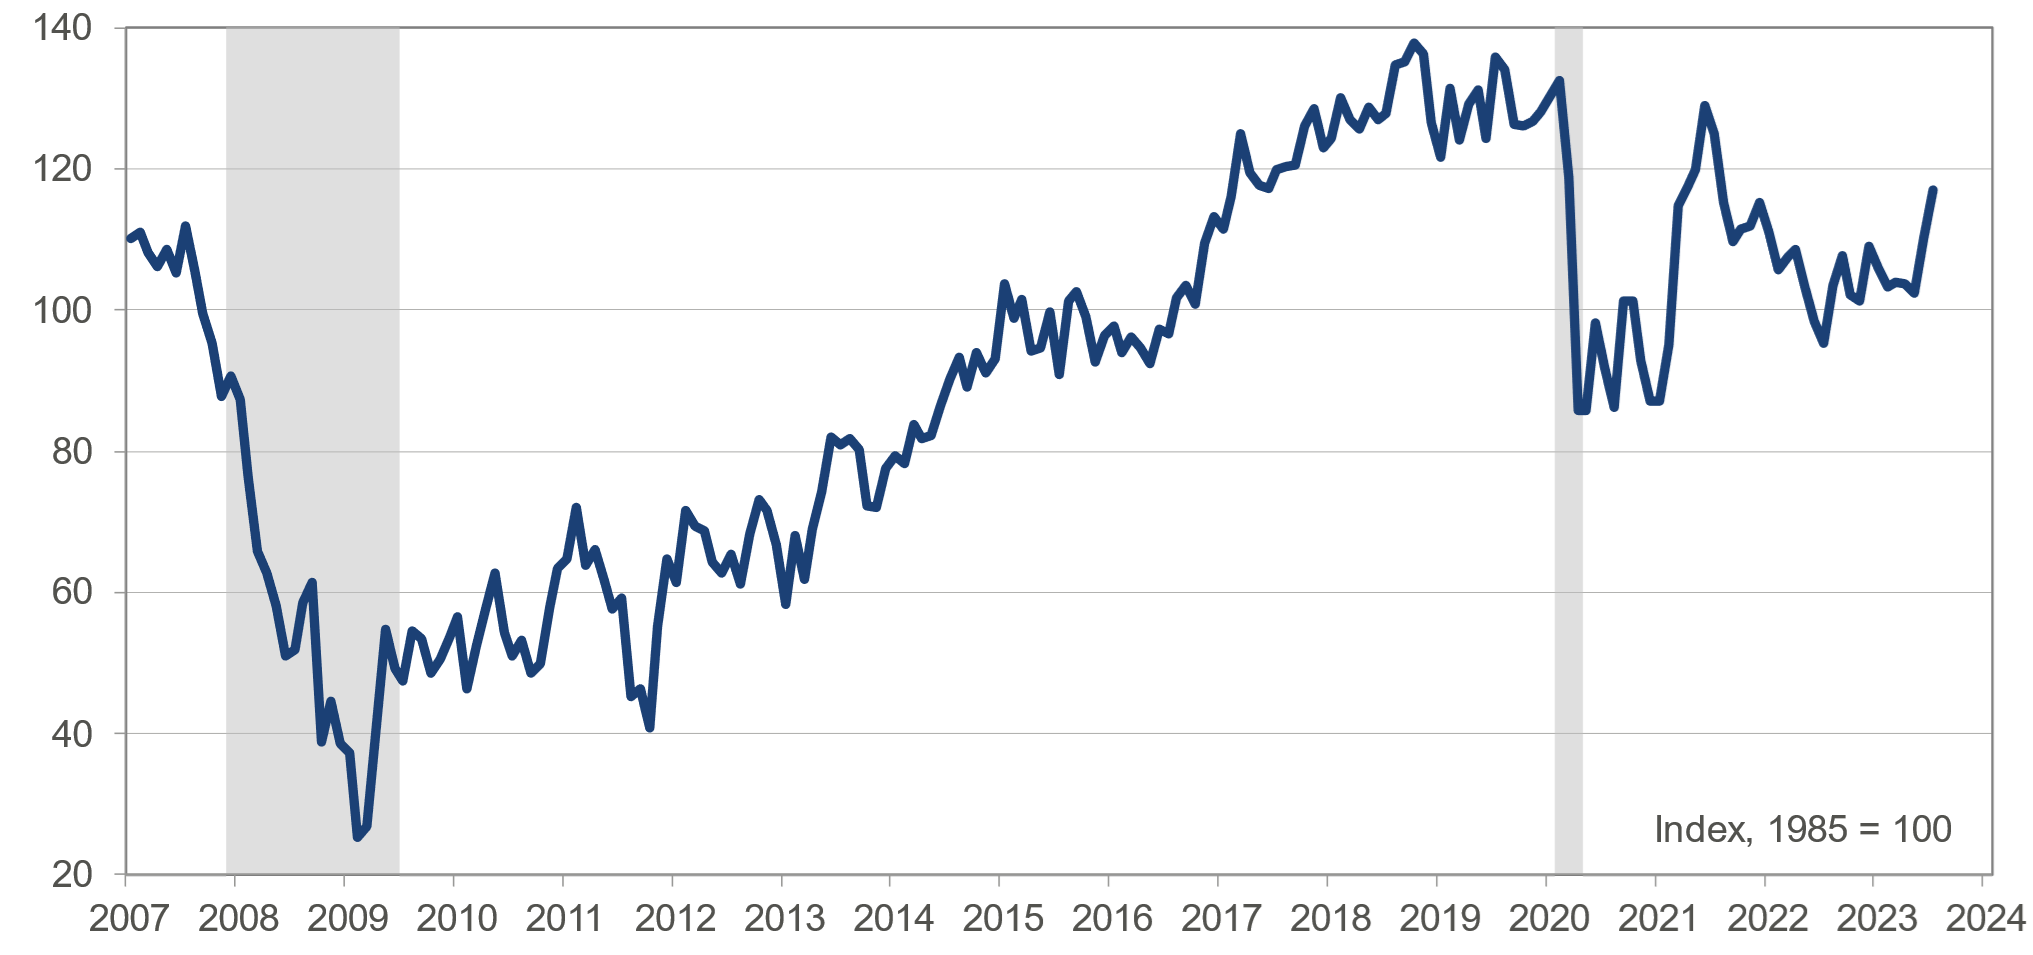
When these indicators start to decline or show a pattern of negative movement, it can signal an impending recession. The consumer confidence index for July hit a reading of 117, the highest level in two years. Moreover, according to The Conference Board, the probability of a recession in the next six months is 25%, down from 30% in June.
Purchasing managers’ index (PMI)
The purchasing managers’ index (PMI) is based on five major indicators: new orders, inventory levels, production, supplier deliveries and the employment environment. A PMI of more than 50 represents an expansion, while readings under 50 represent a contraction. The PMI is seen as a very reliable tool, as it provides timely and accurate data on the manufacturing sector.
The S&P Global U.S. Manufacturing PMI fell to 46.0 in July 2023, down from 46.9 in June and 48.4 in May. This is the lowest reading since December 2022, and it indicates that the manufacturing sector is in a state of contraction. In short, the global economy is slowing down, and this is having a negative impact on demand for exports from the United States.
The Federal Reserve is in a tight spot
The U.S. economy is currently presenting mixed signals. Despite a robust consumer demand underpinned by rising wages and low unemployment, industrial growth indicators have remained weak throughout 2023. Moreover, bond markets suggest market reluctance to add risk-on positions.
This hesitancy is due to the Federal Reserve’s anticipated monetary policy tightening and further expected interest rate hikes for 2023. These different signals show the tricky situation for those in charge of the interest rates.
If the Fed tightens policy too much, it could slow down the economy too quickly, possibly leading to a recession. On the other hand, if the Fed is too lenient, it could trigger high inflation, which erodes purchasing power and can destabilize the currency.
Related: Bitcoin price is down, but data signals that $30K and above is the path of least resistance
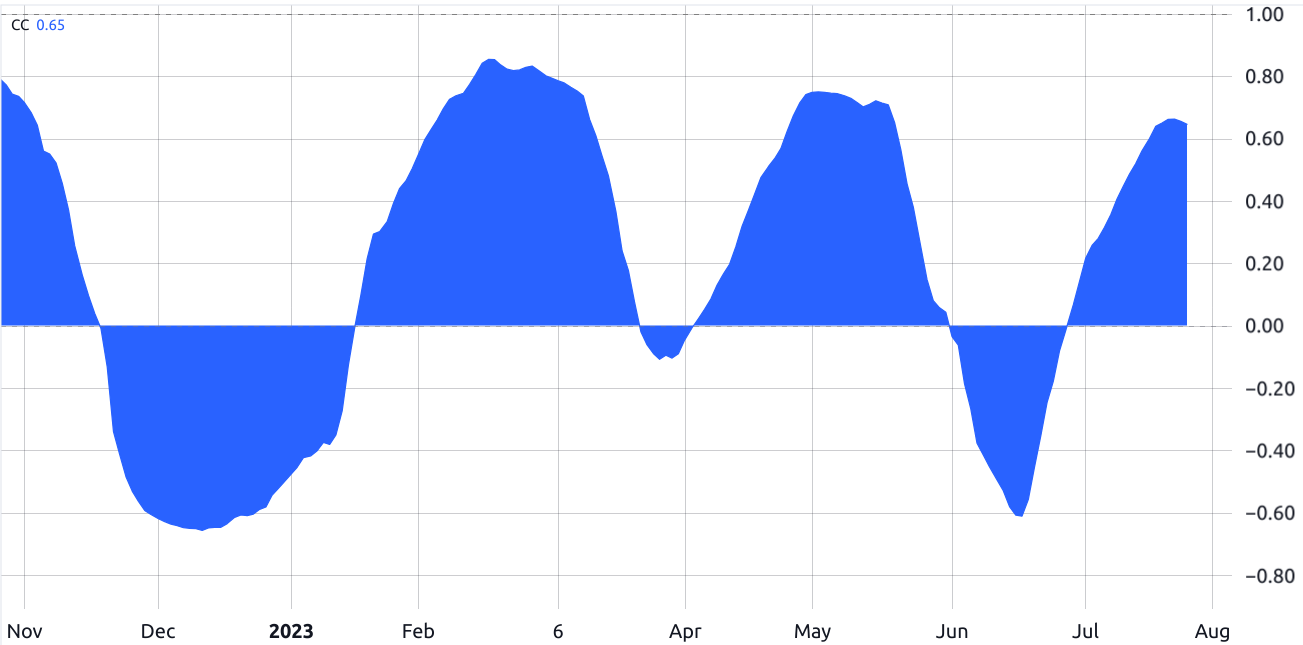
For cryptocurrency investors, there’s an additional variable that further complicates the analysis. Despite the long-term high correlation between Bitcoin (BTC) and the stock market, the past eight months have displayed periods of inverse trend, meaning the assets moved in distinct directions.
Amid crypto market uncertainty, the Fed’s decisions are key to revealing economic confidence. Increasing interest rates signifies stability, potentially benefiting cryptocurrency markets in the short term, whereas rate cuts may indicate economic concerns, possibly affecting risk-on markets in general. Therefore, tracking the Fed provides timely investor guidance in uncertain economic times.
This article is for general information purposes and is not intended to be and should not be taken as legal or investment advice. The views, thoughts, and opinions expressed here are the author’s alone and do not necessarily reflect or represent the views and opinions of Cryptox.


