

Ripple’s token price is correcting gains from $0.550 against the US Dollar. XRP price could start a fresh bullish wave unless there is a close below $0.50.
- Ripple’s token price is correcting gains from the 0.550 resistance against the US dollar.
- The price is now trading above $0.505 and the 100 simple moving average (4 hours).
- There is a key bullish trend line forming with support near $0.504 on the 4-hour chart of the XRP/USD pair (data source from Kraken).
- The pair might start a fresh increase if it stays above the $0.500 and $0.490 support levels.
Ripple’s Token Price Holds Key Support
In the last XRP price prediction, we discussed a decent increase against the US Dollar. The price remained well-bid above the $0.520 level and climbed further higher, like Bitcoin and Ethereum.
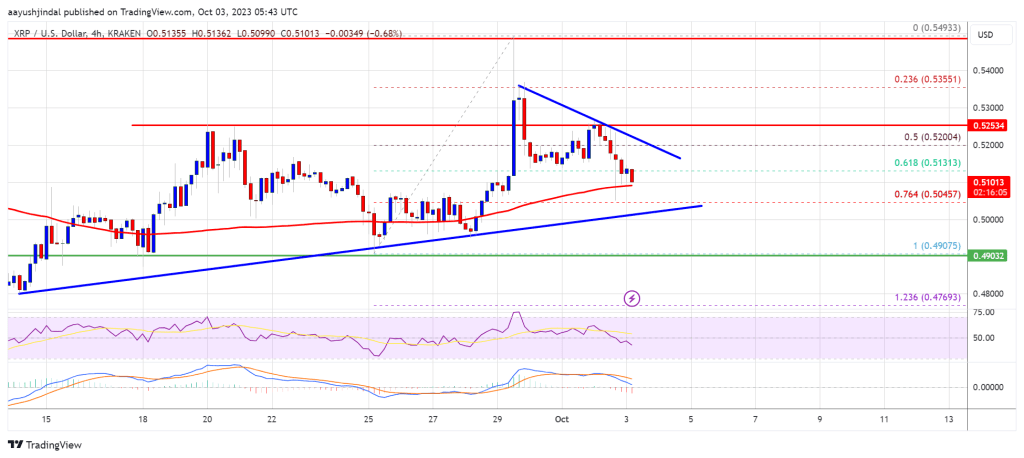
The price surpassed the $0.532 resistance and tested $0.550. A high was formed near $0.5493 and the price saw a downside correction. There was a move below $0.532 and $0.525. There was a break below the 50% Fib retracement level of the upward move from the $0.4907 swing low to the $0.5493 high.
However, XRP is still trading above $0.505 and the 100 simple moving average (4 hours). Besides, there is a key bullish trend line forming with support near $0.504 on the 4-hour chart of the XRP/USD pair.
Source: XRPUSD on TradingView.com
On the upside, immediate resistance is near the $0.515 level. Besides, there is a connecting bearish trend line at $0.520. A close above the $0.520 level could send the price toward the $0.532 barrier. A successful break above the $0.532 resistance level might start a strong increase toward the $0.550 resistance. Any more gains might send XRP toward the $0.580 resistance.
More Losses in XRP?
If ripple fails to clear the $0.532 resistance zone, it could continue to move down. Initial support on the downside is near the $0.5065 zone and the 100 simple moving average (4 hours).
The next major support is at $0.500. If there is a downside break and a close below the $0.500 level, XRP’s price could extend losses. In the stated case, the price could retest the $0.475 support zone.
Technical Indicators
4-Hours MACD – The MACD for XRP/USD is now losing pace in the bullish zone.
4-Hours RSI (Relative Strength Index) – The RSI for XRP/USD is now below the 50 level.
Major Support Levels – $0.505, $0.500, and $0.490.
Major Resistance Levels – $0.520, $0.532, and $0.550.


