

Bitcoin price is stuck in a broad range below the $11,000 resistance against the US Dollar. BTC is likely to decline sharply if it continues to fail near $10,800 and $11,000.
- Bitcoin is struggling to gain bullish momentum and it is well below the $11,000 resistance.
- The price is approaching the 100 hourly simple moving average and the $10,750 support.
- There is a major contracting triangle forming with resistance near $10,850 on the hourly chart of the BTC/USD pair (data feed from Kraken).
- The pair could either surge above $10,850 or it might start a fresh decline towards $10,200.
Bitcoin Price is Stuck in a Range
After a sharp bearish reaction from the $10,950 zone, bitcoin price found support near the $10,650 level against the US Dollar. The bears made a couple of attempts to clear the $10,650 support, but they failed.
The recent low was formed near $10,647 before the price recovered above $10,750. The price traded as high as $10,860 and it is currently correcting lower. There was a break below the 23.6% Fib retracement level of the recent rise from the $10,647 low to $10,860 high.
Bitcoin is now approaching the 100 hourly simple moving average and the $10,750 support. It is close to the 50% Fib retracement level of the recent rise from the $10,647 low to $10,860 high.
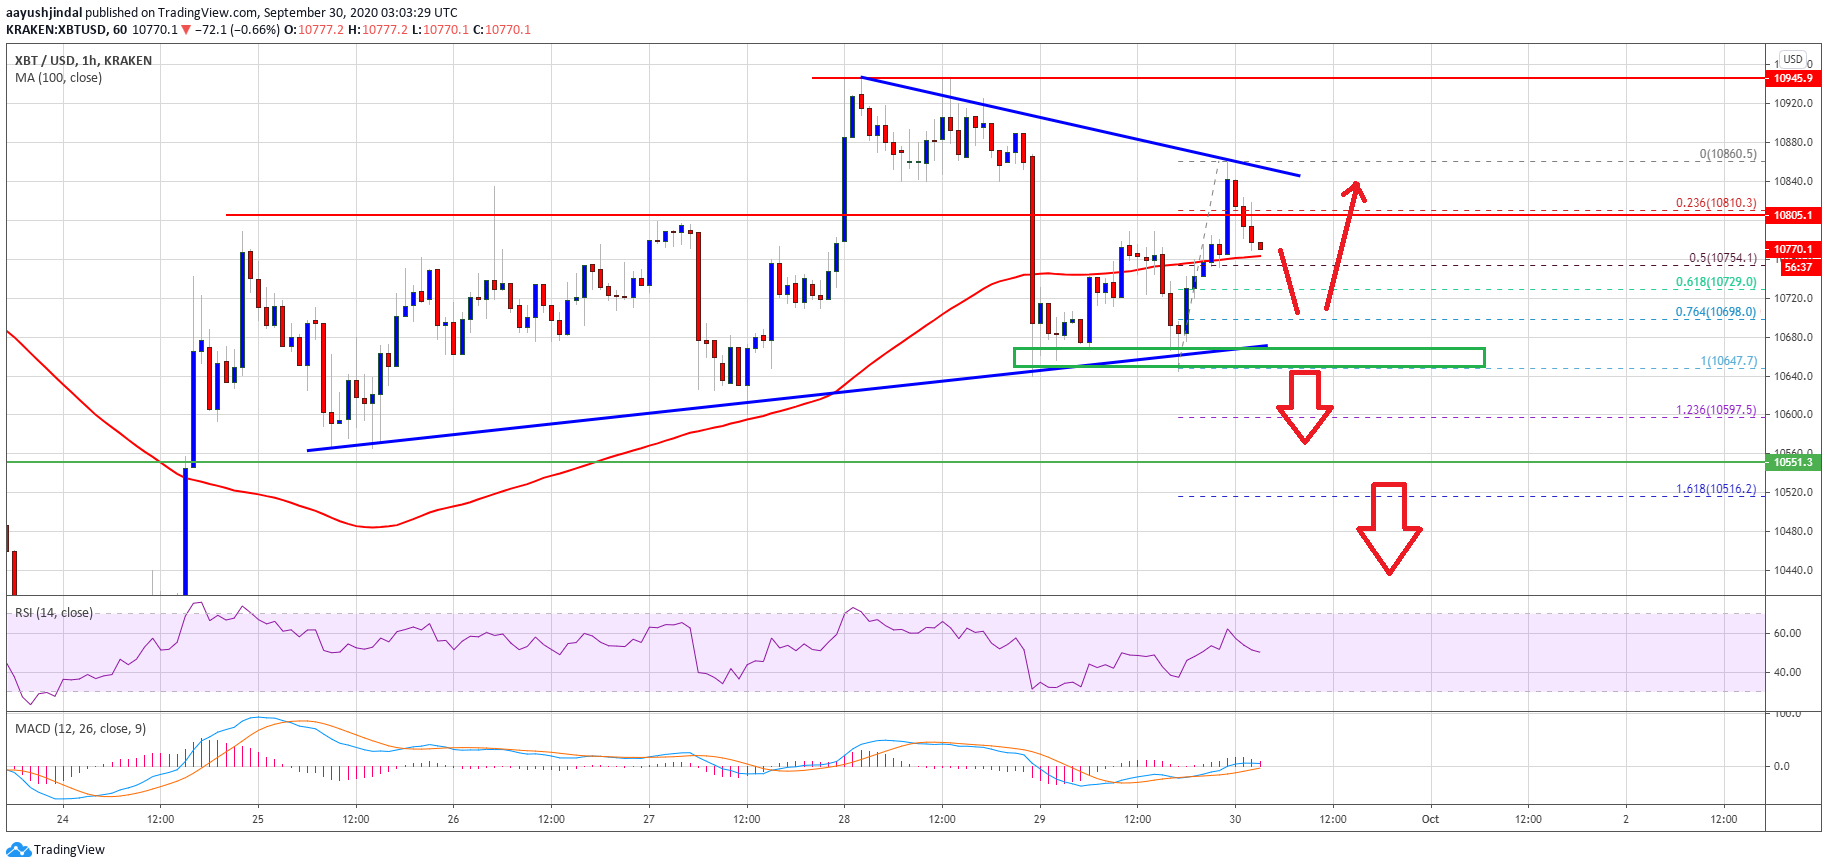
Bitcoin price trades below $10,800. Source: TradingView.com
It seems like there is a major contracting triangle forming with resistance near $10,850 on the hourly chart of the BTC/USD pair. To start a strong increase, the price must clear the triangle resistance and then the $10,950 zone.
The main hurdle is still near the $11,000 resistance, above which there are real chances of a sustained upward move towards the $11,500 and $11,600 levels in the near term.
Downsides Break in BTC?
If bitcoin fails to climb above the $10,800 and $10,850 resistance levels, there is a risk of a downside break. The first key support is near the triangle lower trend line or $10,650.
A clear break below the $10,650 support might increase chances of more downsides below the main support zone at $10,550. In the stated case, the price is likely to dive towards $10,200 or even $10,000 in the coming sessions.
Technical indicators:
Hourly MACD – The MACD is struggling to gain pace in the bullish zone.
Hourly RSI (Relative Strength Index) – The RSI for BTC/USD is currently testing the 50 level.
Major Support Levels – $10,650, followed by $10,550.
Major Resistance Levels – $10,850, $10,950 and $11,000.


