Bitcoin’s reported $172 billion market cap may be a point of pride for cryptocurrency enthusiasts everywhere, but how accurate is it as a measure of Bitcoin’s worth?
Not much.
In fact, new data from CoinMetrics suggests the true Bitcoin price amounts to far less than we’re led to believe.
Bitcoin: ‘Market Cap’ Diverges Wildly From ‘Realized Cap’
The market cap of Bitcoin is calculated by multiplying the number of coins in circulation by the current coin price. Hence 17,905,500 BTC at $9,605 per coin results in a market cap of $171.9 billion as I write this.
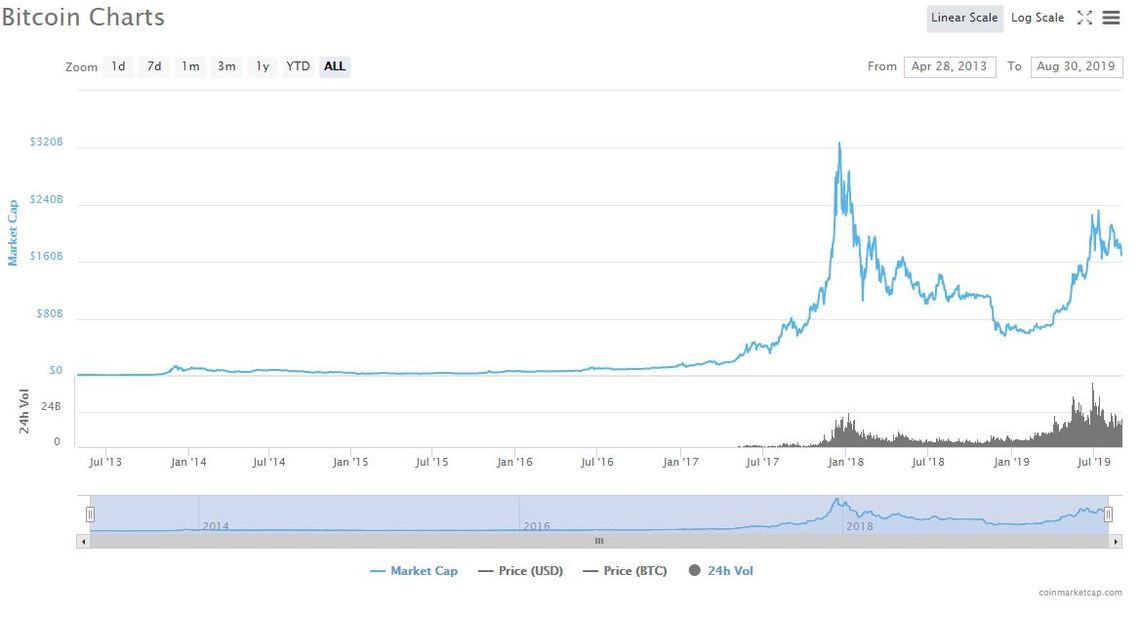
But this method assumes all coins have the same market value, when in fact most were bought at different times – and at radically different prices.
According to CoinMetrics, “Realized cap” takes this into account, rather than quote a price that values nearly 18 million coins – many of which are lost forever – based on what the last one traded for:
“Realized cap, on the other hand, values each coin at the time it was last exchanged. So if a coin was last touched for $2,500 in 2017, that particular coin would be priced at $2,500 instead of the current market price.”
Using this method reveals Bitcoin’s total realized market cap to be just $100 billion – a 41% reduction on what’s displayed on CoinMarketCap.
In fact, Bitcoin’s realized cap only just crossed the $100 billion barrier on August 25th. That’s right, the “realized Bitcoin price” just hit a new all-time high, even though BTC is nominally worth less than half of its December 2017 peak.
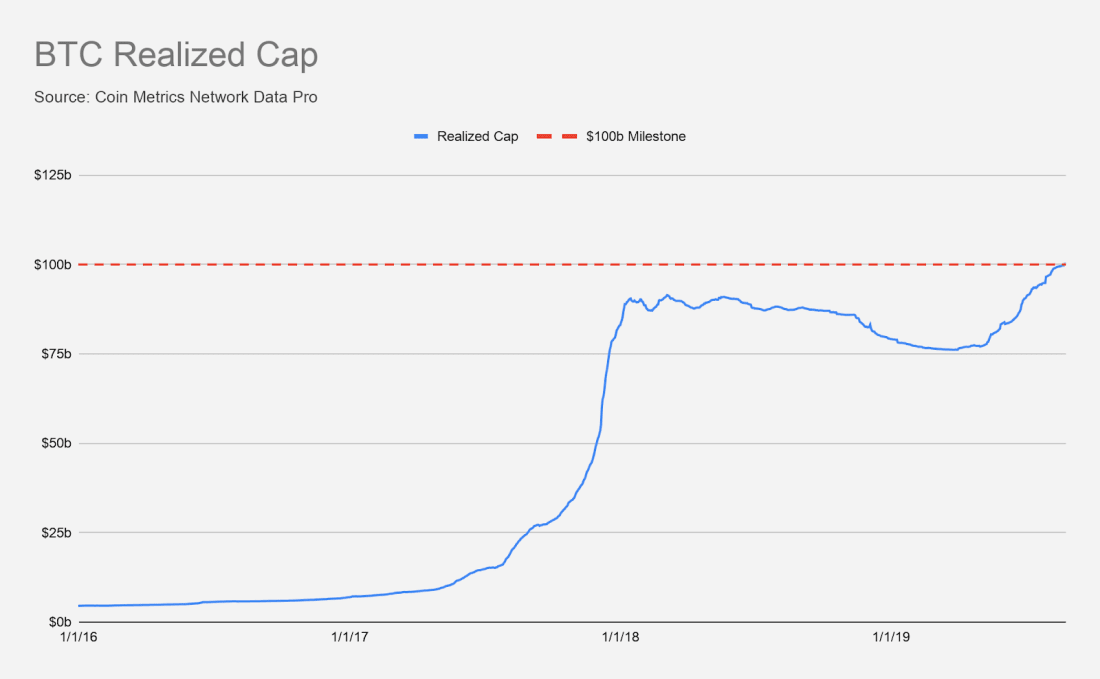
These calculations use the last time a coin was transferred to calculate the price it was purchased at, so there is still room for error.
However, it’s not all bad news, because the same data shows that Bitcoin is slowly drawing closer to its true value.
BTC Sellers Are Disappearing Fast
The chart below shows the distribution of holders ordered by the price range at which they bought Bitcoin. As you can see, the largest weighting of holders can be found in and around the $10,000 range.
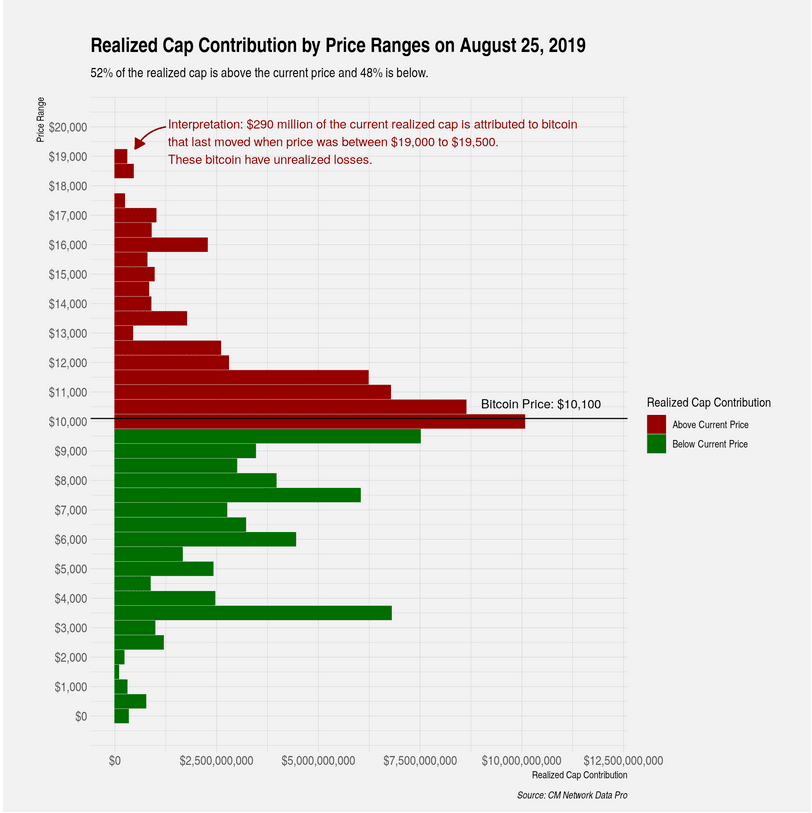
However, this wasn’t always the case. As recently as January 2018, the majority of coin holders were those who had bought in closer to the $20,000 range, as seen below.
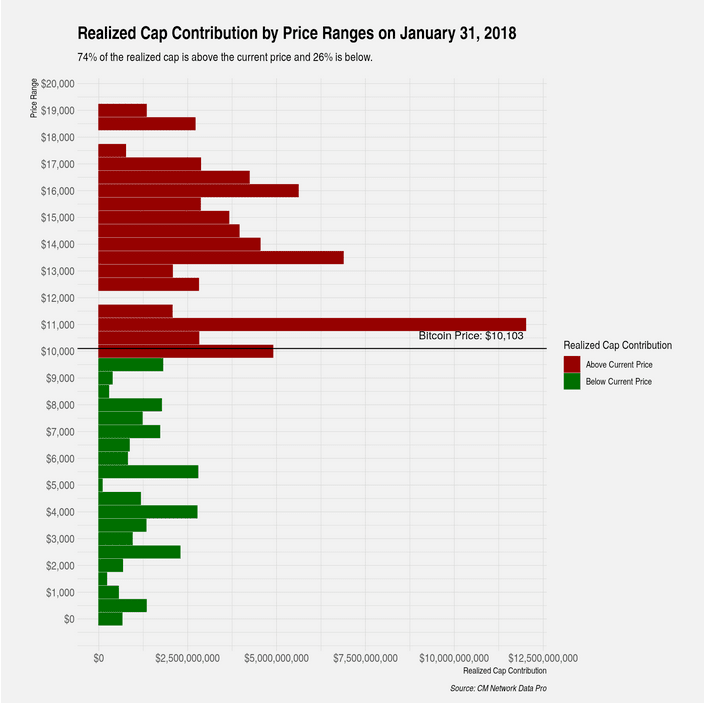
The reduction in those red bars over the past 18 months is a sign that many high-priced holders have sold off their assets.
This is good news for Bitcoin’s price stabilization since it means the majority of those who are most likely to sell have already done so.
Click here for a real-time Bitcoin price chart.


