

Ethereum is up more than 5% and it broke the $130 resistance area against the US Dollar. However, the main $135 resistance area is still acting as a major hurdle for ETH bulls.
- Ethereum gained traction and it broke the $130 ad $132 resistance levels against the US Dollar.
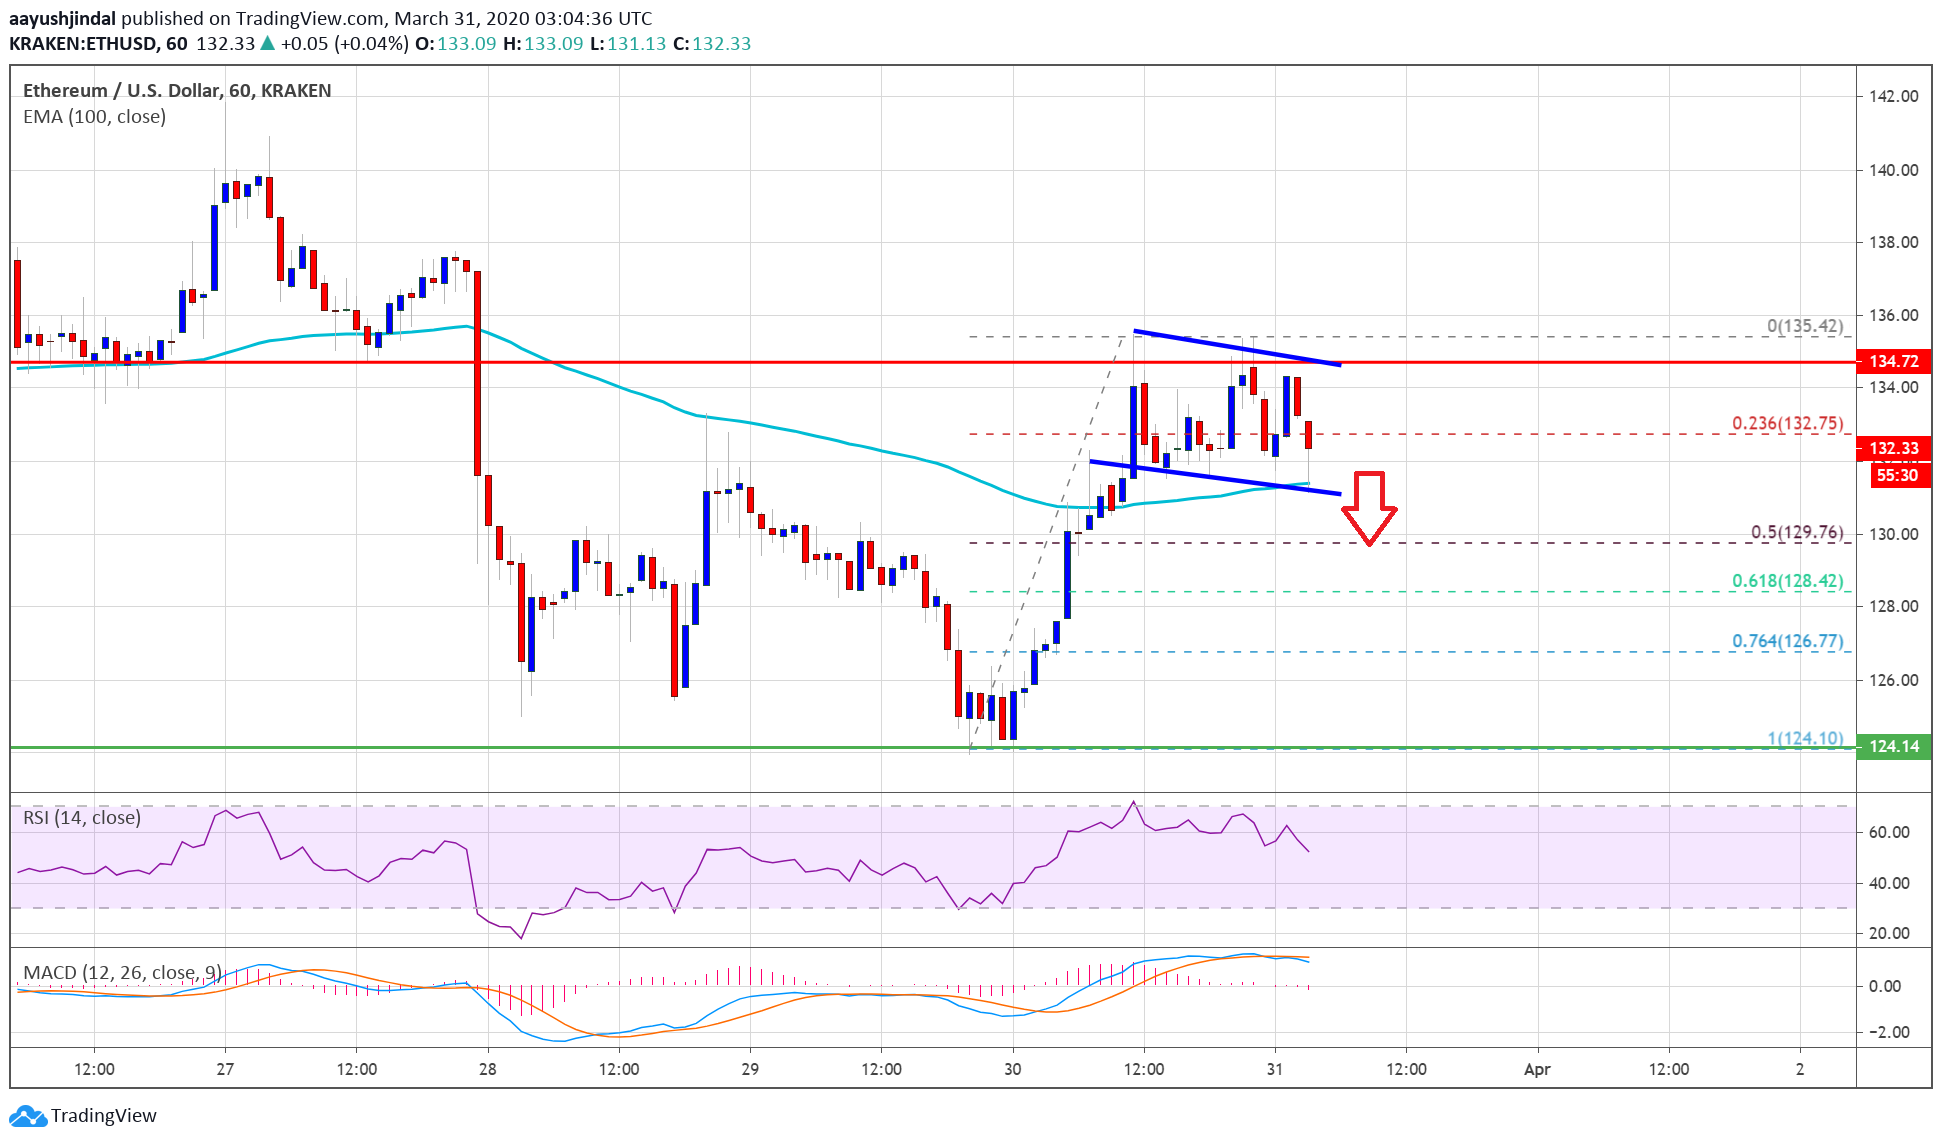
- The price is currently facing a major resistance near the $135 level (the previous support).
- There is a short term declining channel or a flag pattern forming with resistance near $135 on the hourly chart of ETH/USD (data feed via Kraken).
- The pair could either rally above the $135 barrier or it might restart its downward move.
Ethereum Price Testing Key Resistance
After tagging the $125 support area, Ethereum started a fresh upward move against the US Dollar. ETH price was able to clear the $130 resistance area to move into a positive zone.
The bulls were able to push the price above the $132 level and the 100 hourly simple moving average. The price is up more than 5%, but it is now facing a strong hurdle near the $135 area (the previous support zone).
Ethereum made a couple of attempts to clear the $135 barrier, but it failed. It is currently trading near the 23.6% Fib retracement level of the recent rise from the $124 low to $135 high.
It seems like there is a short term declining channel or a flag pattern forming with resistance near $135 on the hourly chart of ETH/USD. If the bulls are able to clear the $135 resistance area, there are chances of a steady rise towards the $140 and $145 resistance levels.
Any further gains may perhaps start a nice uptrend and the price is likely to test the $155 resistance zone.
Another Drop?
If Ethereum continues to struggle near the $135 resistance, it could decline again. An initial support is near the channel support and the 100 hourly SMA.
A clear break below the $132 level could lead the price towards the $130 support. The 50% Fib retracement level of the recent rise from the $124 low to $135 high is also near the $130 level. Any further losses are likely to accelerate the decline and the price might test the $124 low.
Technical Indicators
Hourly MACD – The MACD for ETH/USD is currently losing momentum in the bullish zone.
Hourly RSI – The RSI for ETH/USD is currently correcting lower and it is approaching the 50 level.
Major Support Level – $130
Major Resistance Level – $135
Take advantage of the trading opportunities with Plus500
Risk disclaimer: 76.4% of retail CFD accounts lose money.


