

Ripple traded higher and broke the $0.2000 resistance following bitcoin price rise against the US Dollar. However, XRP is still facing many hurdles near $0.2100 and $0.2200.
- Ripple is trading higher and it managed to clear the $0.1980 and $0.2000 resistance levels against the US dollar.
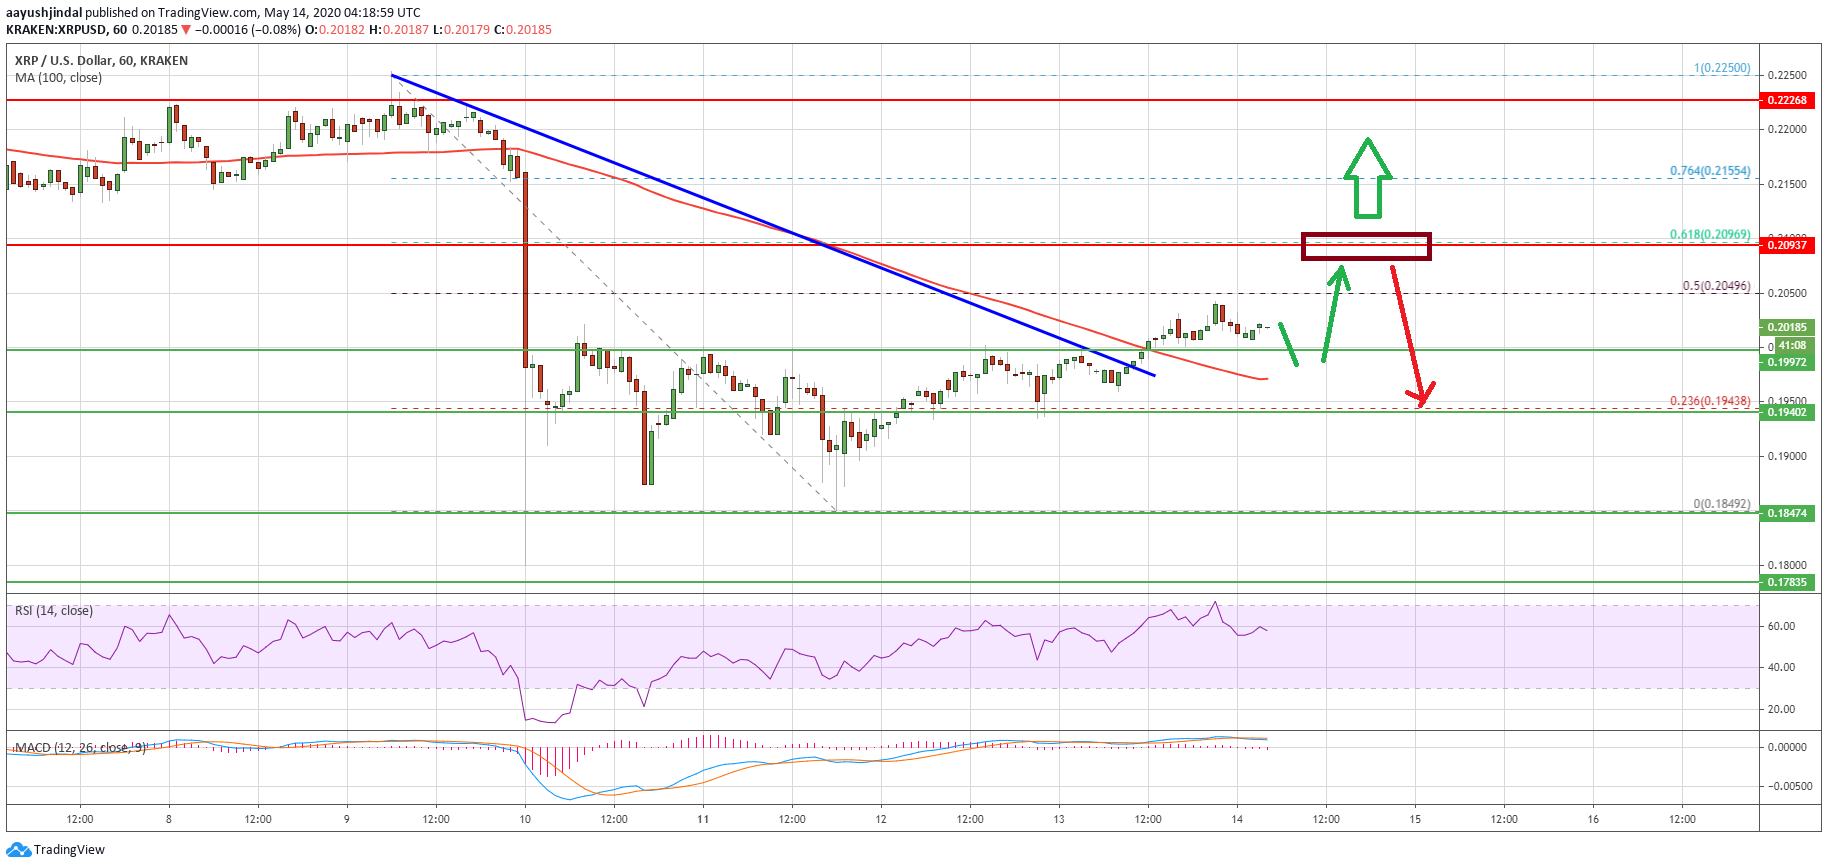
- The price is currently facing a key resistance zone near the $0.2050 level.
- There was a break above a major bearish trend line with resistance near $0.1980 on the hourly chart of the XRP/USD pair (data source from Kraken).
- The pair is likely to struggle near the $0.2050 or $0.2100 resistance levels.
Ripple Price is Still in Downtrend
Recently, bitcoin gained bullish momentum and climbed sharply above $9,000, sparking an upward move in ripple above $0.1950. XRP price broke the $0.1980 resistance zone to move into a short term positive zone.
The bulls pushed the price above the 23.6% Fib retracement level of the main decline from the $0.2250 high to $0.1849 swing low. There was also a break above a major bearish trend line with resistance near $0.1980 on the hourly chart of the XRP/USD pair.
Ripple is now trading above the $0.2000 level and the 100 hourly simple moving average. On the upside, an initial resistance is near the $0.2050 level. It is near the 50% Fib retracement level of the main decline from the $0.2250 high to $0.1849 swing low.
The next major resistance is near the $0.2100 zone (the last key breakdown zone. If XRP gains bullish momentum above the $0.2100 resistance, the bulls are likely to aim a test of the $0.2200 level in the near term. Any further gains might push the price into a strong uptrend and it could surge towards $0.2280 and $0.2350.
Another Decline in XRP?
If ripple fails to continue above the $0.2050 and $0.2100 resistance levels, there might be another decline. An initial support is near the $0.2000 level.
The first major support is near the 100 hourly SMA at $0.1970, followed by the $0.1950 pivot level. In case the price declines below the $0.1950 support, the bears are likely to aim a test of the $0.1850 low.
Technical Indicators
Hourly MACD – The MACD for XRP/USD is currently losing momentum in the bullish zone.
Hourly RSI (Relative Strength Index) – The RSI for XRP/USD is currently well above the 50 level.
Major Support Levels – $0.2000, $0.1950 and $0.1920.
Major Resistance Levels – $0.2050, $0.2100 and $0.2200.
Take advantage of the trading opportunities with Plus500
Risk disclaimer: 76.4% of retail CFD accounts lose money.
Featured image from unsplash.


