

Chainlink’s LINK price is up over 40% and trading above $10. The bulls seem to be in control and might aim a rally toward the $12 resistance.
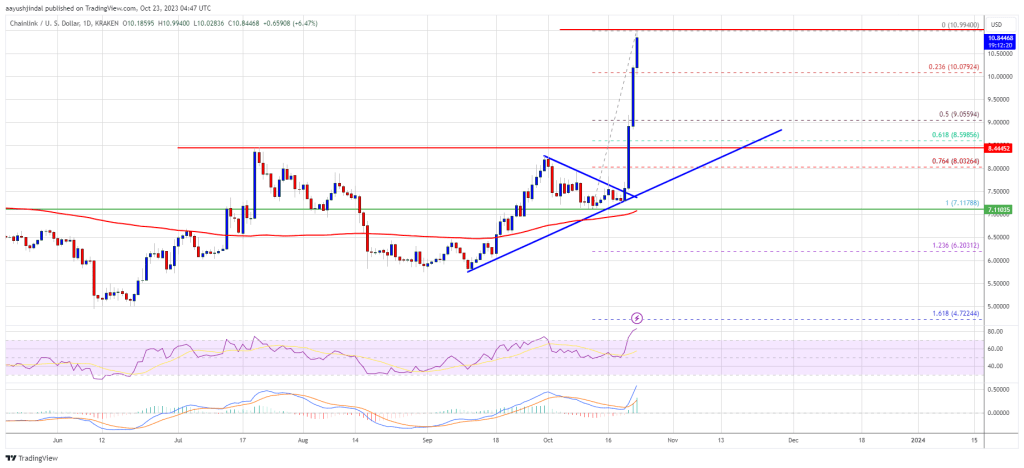
- Chainlink price is gaining pace above the $10.00 resistance against the US dollar.
- The price is trading above the $10.00 level and the 100-day simple moving average.
- There is a key bullish trend line forming with support near $8.60 on the daily chart of the LINK/USD pair (data source from Kraken).
- The price could continue to move up toward the $11.25 and $12.00 resistance levels.
Chainlink Price Starts Fresh Rally
In the past few days, LINK price started a strong rally against the US Dollar. The price formed a base above the $7.00 level before the bulls stepped in. There was a major pump above the $7.50 and $8.00 resistance levels.
In the last three days, the price gained over 40% and cleared many hurdles near $9.00. The recent pump in Bitcoin also helped LINK surpass the $10.00 resistance. A new multi-week high is formed near $10.99. The price is now consolidating gains well above the 23.6% Fib retracement level of the upward move from the $7.11 swing low to the $10.99 high.
LINK is now trading above the $10.00 level and the 100 simple moving average (4 hours). There is also a key bullish trend line forming with support near $8.60 on the daily chart of the LINK/USD pair. The trend line is near the 61.8% Fib retracement level of the upward move from the $7.11 swing low to the $10.99 high.
Source: LINKUSD on TradingView.com
If there is a fresh increase, the price might face resistance near $11.20. The first major resistance is near the $12.00 zone. A clear break above $12.00 may possibly start a steady increase toward the $12.20 and $12.50 levels. The next major resistance is near the $13.20 level, above which the price could test $15.00.
Are Dips Limited in LINK?
If Chainlink fails to climb above the $11.20 resistance level, there could be a downside correction. Initial support on the downside is near the $10.00 level.
The next major support is near $9.00, below which the price might test the trend line support at $8.60. Any more losses could lead LINK toward the $8.00 level in the near term.
Technical Indicators
4 hours MACD – The MACD for LINK/USD is gaining momentum in the bullish zone.
4 hours RSI (Relative Strength Index) – The RSI for LINK/USD is now above the 50 level.
Major Support Levels – $10.00 and $9.00.
Major Resistance Levels – $11.20 and $12.00.


