

Ethereum price started a decent increase after Bitcoin gained momentum against the US dollar. ETH is rising and might test the key $1,750 resistance.
- Ethereum started a decent increase above the $1,650 resistance.
- The price is trading above $1,660 and the 100-hourly Simple Moving Average.
- There is a key bullish trend line forming with support near $1,645 on the hourly chart of ETH/USD (data feed via Kraken).
- The pair could climb further higher, but it might face strong resistance near $1,750.
Ethereum Price Reclaims $1,650
Ethereum stayed above the $1,550 support zone. The recent pump in Bitcoin above the $28,500 resistance sparked bullish moves in ETH. There was a steady increase above the $1,600 and $1,620 resistance levels.
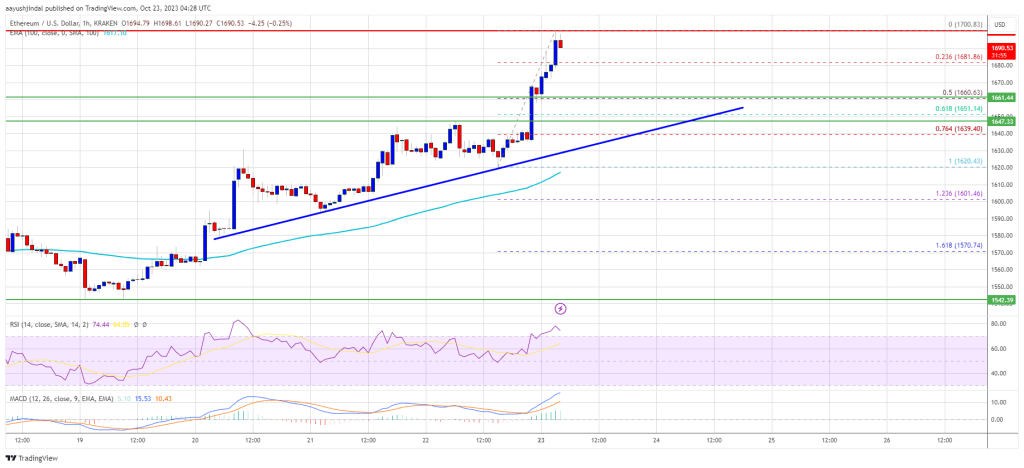
The price even cleared the key $1,650 resistance zone. A high is formed near $1,700 and the price is now consolidating gains. It is trading well above the 23.6% Fib retracement level of the upward move from the $1,620 swing low to the $1,700 high.
Ethereum is now trading above $1,660 and the 100-hourly Simple Moving Average. There is also a key bullish trend line forming with support near $1,645 on the hourly chart of ETH/USD. The trend line is near the 61.8% Fib retracement level of the upward move from the $1,620 swing low to the $1,700 high.
On the upside, the price is facing resistance near the $1,700 level. The first major resistance is near the $1,720 zone. The next key resistance is $1,750, where the bears might emerge. To continue higher, the price must settle above the $1,750 resistance.
Source: ETHUSD on TradingView.com
In the stated case, Ether could start a strong increase toward the $1,880 resistance. Any more gains might open the doors for a move toward $2,000.
Downside Correction in ETH?
If Ethereum fails to clear the $1,700 resistance, it could start a downside correction. Initial support on the downside is near the $1,660 level.
The next key support is $1,645 and the trend line zone. A downside break below the $1,645 support might send the price further lower. In the stated case, the price could drop toward the $1,620 level and the 100-hourly Simple Moving Average. Any more losses may perhaps send Ether toward the $1,550 level.
Technical Indicators
Hourly MACD – The MACD for ETH/USD is gaining momentum in the bullish zone.
Hourly RSI – The RSI for ETH/USD is now above the 50 level.
Major Support Level – $1,645
Major Resistance Level – $1,700


