Ether (ETH) options open interest grew by 230% to reach $393 million in the past three months. Although this is an impressive figure, it doesn’t fully reflect how the derivative instruments being used.
Ether options open interest, USD. Source: Skew
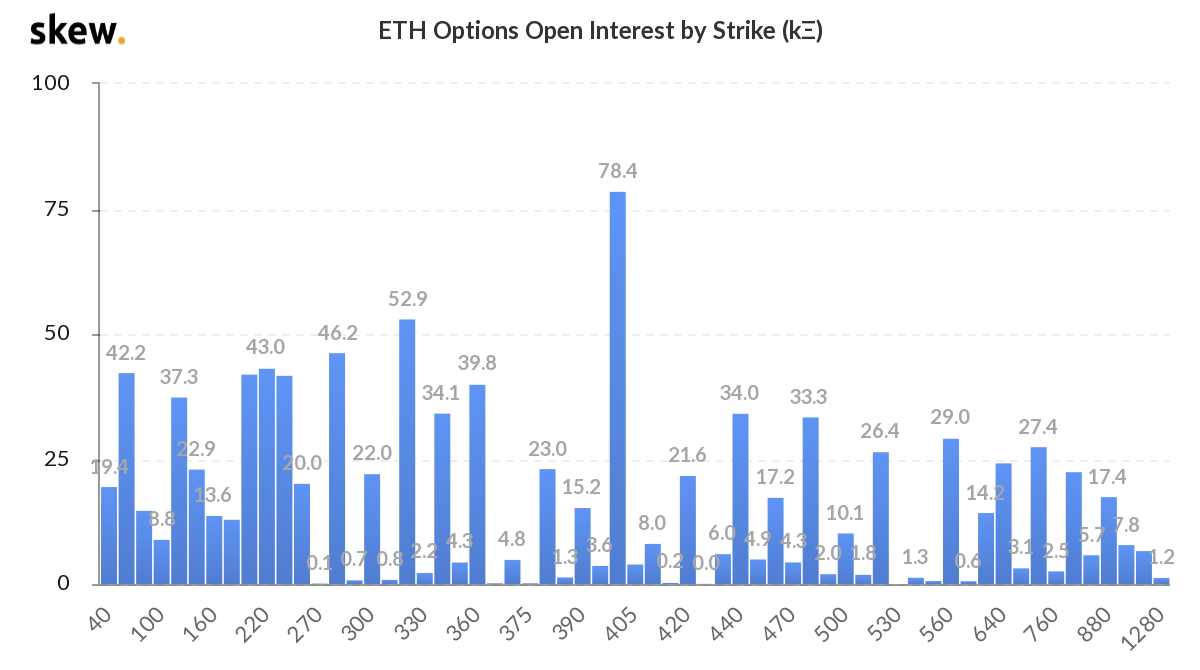
Strike levels appear bullish
The first thing one should take note of is the most used price levels (strikes). Once again, this information does not provide a clear picture of whether these options are mostly used for bullish or bearish strategies.
In general, a chart heavily populated with strikes below the current market level indicates that either traders were taken by surprise due to a recent hike, or fewer investors are currently bullish.
Ether options by strike level, (thousands). Source: Skew
According to the above data, there are presently 535K Ether options open interest with strikes at $380 and below. On the other hand, there are only 243K Ether options at $425 or higher.
This could be partially be explained by the 68% bull run to the $400 level which occurred in late July, although this is not necessarily a positive indicator.
Unlike futures contracts, options are divided into two segments. Call (buy) options allow the buyer to acquire Ether at a fixed price on the expiry date. On the other hand, the seller of the instrument will be obliged to make the Ether sale.
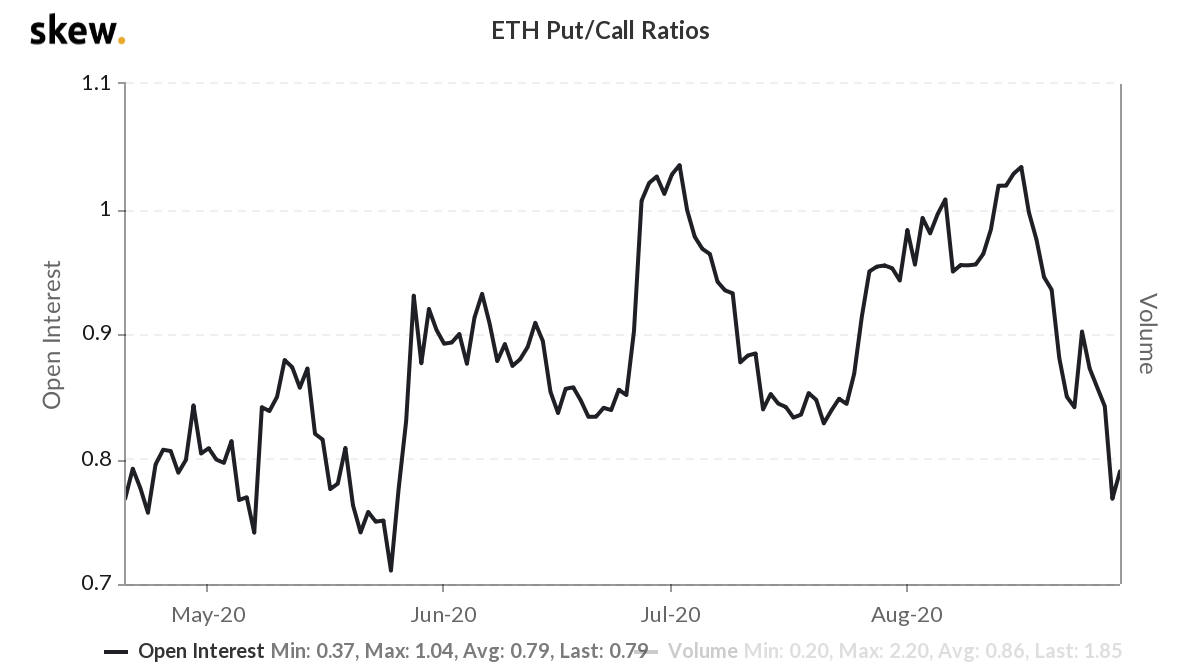
By measuring whether more activity is going through call (buy) options or put (sell) options, it is possible to gauge an overall market sentiment.
Ether options put/call ratio. Source: Skew
There are currently 21% fewer put (sell) options open interest relative to call (buy) instruments. This is the lowest level in 3 months and indicates an overall bullishness from options traders.
Although a good indicator, the put-call ratio reflects trades that might have happened over a month ago. Therefore, to better gauge current market sentiment, one should focus its attention on the 25% delta skew indicator.
Skew indicator confirms bullishness
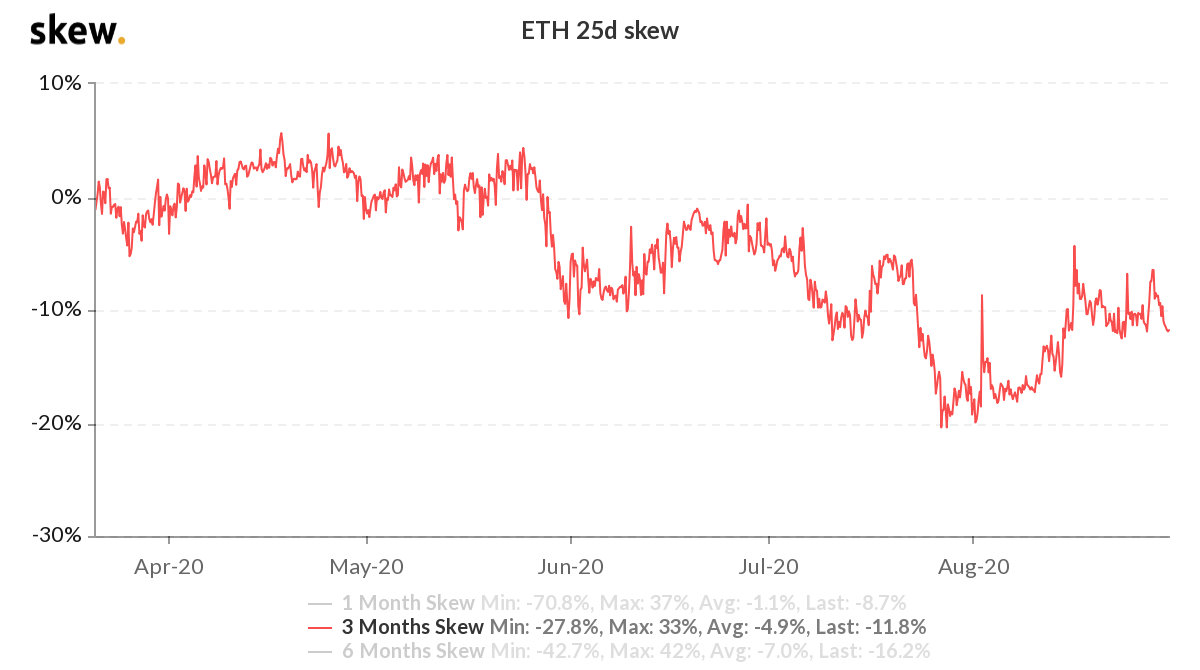
The 25% delta skew compares side-by-side equivalent call (buy) and put (sell) options. If the protection for price upswings using call options is more costlier, the skew indicator shifts to the negative range. The opposite holds when investors are bearish, causing put options to trade at a premium, causing skew indicators to shift positively.
Ether 3-month options 25% delta skew. Source: Skew
The above chart shows a shift to a bullish stance since late-May, reaching a quasi-extreme 20% optimist level late July. Currently the -12% skew lies in bullish terrain, confirming the put-call ratio indicator.
Generally, Ether options seem bullish despite the concentration of strikes below $400 level.
The views and opinions expressed here are solely those of the author and do not necessarily reflect the views of Cryptox. Every investment and trading move involves risk. You should conduct your own research when making a decision.


