

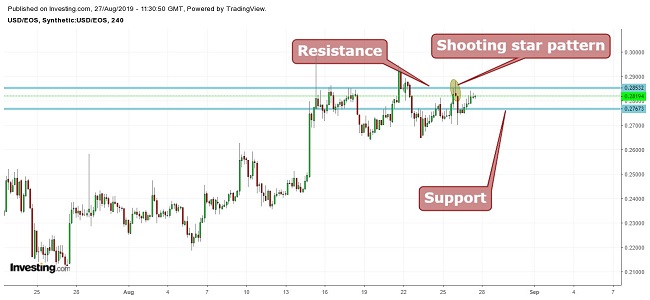
EOS (EOS)trade is currently trading at $0.28194. Although the cryptocurrency’s price is in a uptrend, when considering the past price’s key points, it can be seen it is currently trading around its resistance. The resistance is also marked by formation of shooting star pattern.
The resistance is at $0.2853 and support is at $0.2767. The digital coin’s price is expected to trade between the channel formed by the resistance and support levels until the price breaks out with good volume and closes above $0.2941.
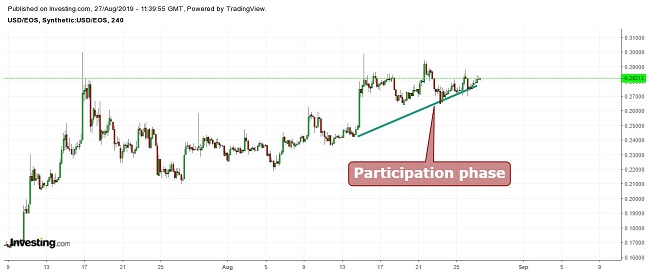
Dow Theory
According to Dow Theory, the virtual coin appears to be in the public participation phase in which more investors enter the market as business conditions improve and positive sentiments become evident. This results in higher prices in the market.
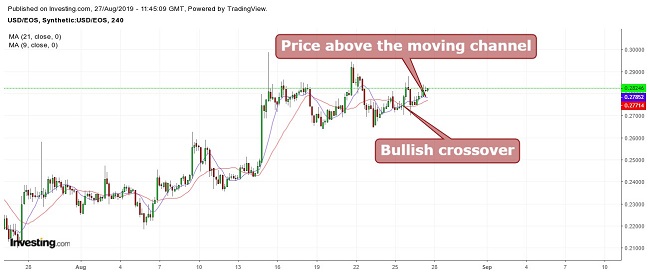
Moving Average
When taking 9 period moving averages (blue) with 21 period moving averages (red), a bullish crossover is seen with the price is above the nine and twenty-one period moving averages, which indicates a positive momentum.
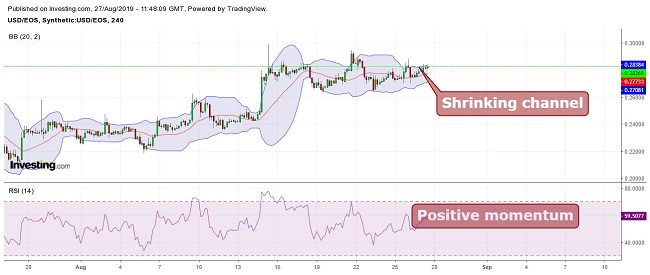
Bollinger Bands
The price is moving between the channels, with the upper limit acting as resistance and the middle average line acting as support. Combining it with the RSI we see a positive momentum, which indicates an upward momentum, but we also see that the channel is shrinking, indicating lesser volatility. However, it is strongly suggested to wait until the price crosses the resistance level or touches support.
Conclusion
EOS (EOS)trade is currently trading at $ 0.28194. The resistance is at $0.2853 and support is at $0.2767. It is suggested not to take any fresh position until the cryptocurrency’s price crosses the $0.2941 mark.
Swing trading can be done using the above-mentioned levels. Mid-term target is at $0.308 and longterm is at $0.333. If the support level is broken, the digital coin can test the $0.242 level. The current momentum is bullish.
Pivot Points
| Name | S3 | S2 | S1 | Pivot Points | R1 | R2 | R3 |
| Classic | 0.27963 | 0.28022 | 0.28105 | 0.28163 | 0.28246 | 0.28304 | 0.28388 |
| Fibonacci | 0.28022 | 0.28076 | 0.28109 | 0.28163 | 0.28217 | 0.28250 | 0.28304 |
| Camarilla | 0.28150 | 0.28163 | 0.28176 | 0.28163 | 0.28202 | 0.28215 | 0.28228 |
| Woodie’s | 0.27977 | 0.28029 | 0.28119 | 0.28170 | 0.28260 | 0.28311 | 0.28402 |
Technical Indicators
| Name | Value | Action |
| RSI(14) | 57.594 | Buy |
| STOCH(9,6) | 50.342 | Neutral |
| STOCHRSI(14) | 30.603 | Sell |
| MACD(12,26) | 0.001 | Buy |
| ADX(14) | 28.077 | Sell |
| Williams %R | -40.616 | Buy |
| CCI(14) | 46.4933 | Neutral |
| ATR(14) | 0.0015 | Less Volatility |
| Highs/Lows(14) | 0.0000 | Neutral |
| Ultimate Oscillator | 45.626 | Sell |
| ROC | 0.535 | Buy |
| Bull/Bear Power(13) | 0.0015 | Buy |


 Surges 39.5% to a New All-Time High — Here’s Why")
