

The total crypto market cap erased $3.8 billion from its value for the last seven days and now stands at $238.1 billion. The top 10 currencies are all in red for the same time period with EOS (EOS) and Litecoin (LTC) being the worst performers with 14.2 and 13.4 percent of losses respectively. By the time of writing Bitcoin (BTC) is trading at $8,695 while Ether (ETH) is hovering around $188. Ripple’s XRP fell to $0.197.
BTC/USD
Bitcoin moved South to $8,912 on Sunday, May 3 after another failed attempt to break above the $9,000 resistance. It registered a 15.7 increase on a weekly basis.
The BTC/USD pair started trading on Monday by falling down to $8,522 in the early hours of the session. Bulls managed to recover later and successfully climbed above the $8,600 support, closing at $8,871. The next two targets in front of them were the $9,000 line and the diagonal resistance formed by the long-term downtrend.
On Tuesday, May 5, the most popular cryptocurrency formed a green candle on the daily chart and moved up to $9,027 adding 1.7 percent to its value.
The mid-week trading on Wednesday was again positive for the Bitcoin buyers as the coin extended its gains to $9,161. It peaked at $9,417 during intraday, almost hitting the above-mentioned diagonal line.
On Thursday, May 7, the coin skyrocketed all the way up to $10,000 surpassing the horizontal resistance at $9,600 and most importantly the long-term line. It gained 9 percent as bulls were now close to the year-to-date high at $10,360.
Buyers, however, could not consolidate properly and allowed a short correction on Friday. The BTC/USD pair moved down to $9,791.
The move was followed by a successful break into the support zone on Saturday, May 9 and a close to $9,542. Bitcoin was losing momentum days before the halving event and on Sunday it fell below the diagonal resistance, marking the beginning of a downside reversal. It closed the week at $8,700 or 2.4 percent lower.
ETH/USD
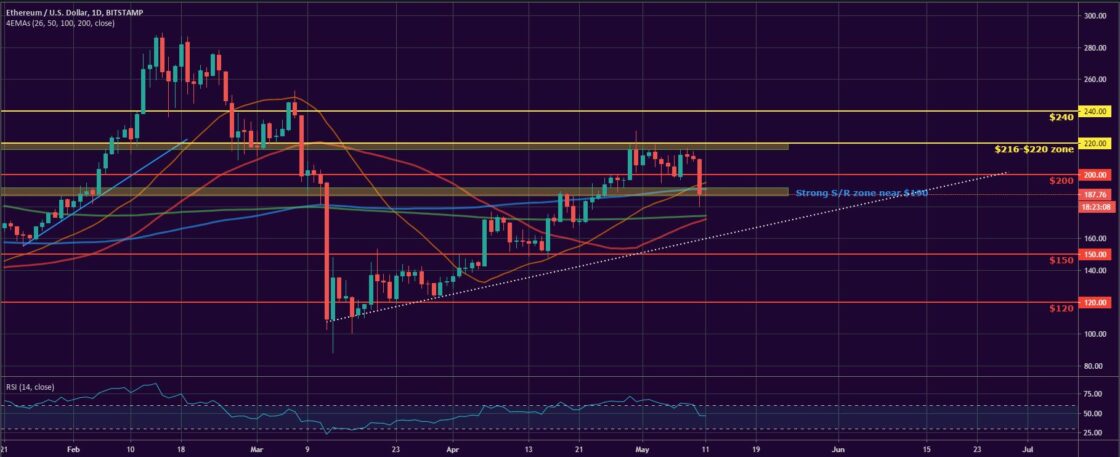
The Ethereum Project token ETH was rejected at $220 for the third time in the last seven days on Sunday, May 3, and moved down to $209. It was 5.5 percent up on a weekly basis.
The coin continued to slide on Monday and fell further to $206 after hitting $194 during intraday, temporarily breaking below the critical support at $200.
On Tuesday, May 5, the ETH/USD pair formed its third consecutive red candle on the daily chart, ending the session at $205. Bulls were already looking at the $200 support line to provide the required stability, followed by $190 down, which was also where the 100-day EMA was passing through.
The third day of the workweek was no different and the ether saw even more red on the chart, falling to $199.
Just as predicted, it found support around the mentioned psychological level, and on Thursday, May 7, rebounded, forming a solid green candle to $212. The coin gained 6.5 percent and once again hit the $216-$220 S/R zone.
On the last day of the workweek, the leading altcoin made a slight correction to its price and closed at $211. This was followed by another red session on the first day of the weekend as bulls were starting to lose ground.
On Sunday, May 10, it crashed below the 100-day EMA and the $200 mark and entered the next support zone at $190-$187. The ETH/USD pair was 10 percent down for the week.
XRP/USD
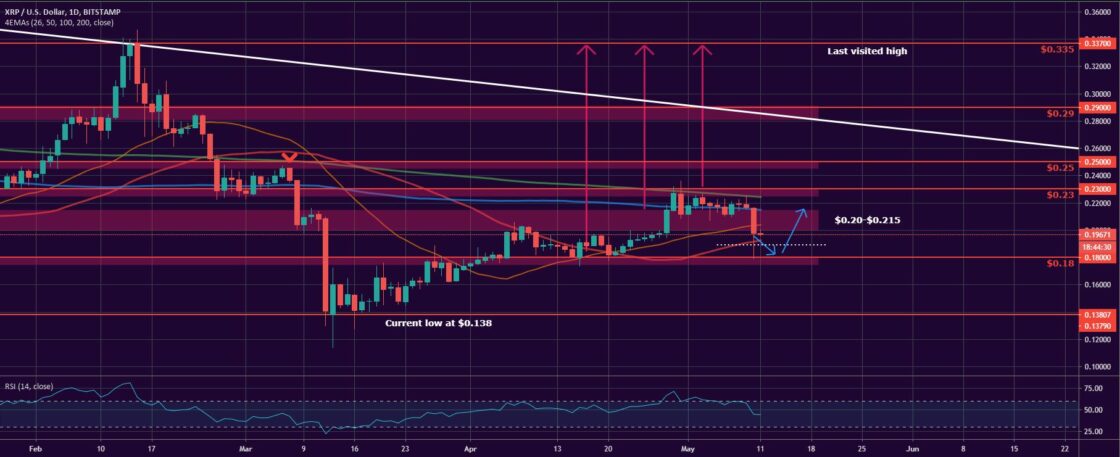
The Ripple company token XRP made a step downwards on Sunday, May 3, and closed the previous week at $0.219 after finding stability in the long-term average. It added 11.2 percent to its value for the period.
The coin started trading on Monday, May 4 by dropping below the 100-day EMA and hitting $0.207 during intraday. It partially recovered in the evening hours, but still closed the day with a small loss to $0.218.
On Tuesday, the XRP/USD pair was quite volatile, moving in the $0.213-$0.223 range. The continuous bear pressure resulted in a further decline, this time to $0.217.
The mid-week session on Wednesday was no different and the major altcoin formed its fourth straight red candle on the daily chart. It finally broke below the $0.215 resistance line and closed the session at $0.211 erasing 3 percent of its value.
On Thursday, May 7 the price of XRP rebounded from the mentioned level and recovered positions near $0.218.
The coin remained flat on the last trading day of the workweek as neither bulls nor bears managed to take over control.
The weekend of May 9-10 started positively for buyers and they managed to reach the meeting point of the horizontal resistance and the 200-day EMA at $0.225. The hard rejection there, however, combined with the general lack of momentum resulted in another leg down, to $0.216.
On Sunday, May 10, the “ripple” followed the general crypto market trend and fell all the way down to $0.197, surpassing the major support zone at $0.20-$0.215. The token was 10 percent down for the week.
Altcoin of the Week
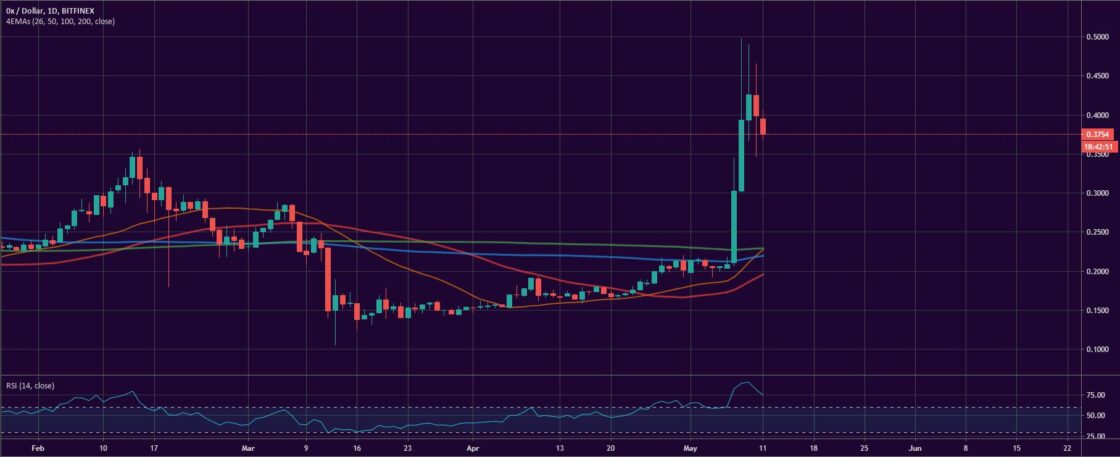
Our Altcoin of the week is 0x (ZRX). This Ethereum-based open-source infrastructure for developers and businesses allows trading of assets and cryptocurrencies using smart contracts on the 0x chain.
The ZRX token added 72 percent to its value for the last seven days and doubled in price for the two-week period. The coin peaked at $0.468 on Saturday, May 9, and is currently ranked at #36 on the CoinGecko’s Top 100 list with a market capitalization of approximately $238 million.
The reason for the surge can be attributed to the overall good performance of the token, also outlined in the latest dev update call held on May 5.
As of the time of writing 0x is trading at $0.375 against USD on Bitfinex.
Like BTCMANAGER? Send us a tip!
Our Bitcoin Address: 3AbQrAyRsdM5NX5BQh8qWYePEpGjCYLCy4

