

The total crypto market cap erased $18.8 billion from its value for the last seven days and now stands at $258 billion. The top 10 currencies are all in red for the same time period with Cardano (ADA) and Bitcoin SV (BSV) being the worst performers with 17.5 and 12 percent of loses respectively. By the time of writing Bitcoin (BTC) is trading at $9,013 while Ether (ETH) dropped down to $221. Ripple’s XRP fells as low as $0.183.
BTC/USD
Bitcoin was extremely volatile on Sunday, June 7. It was trading in the wide range between $9,824 – $9,375 before closing with a short green candle to $9,750. The coin was 4.4 percent down on a weekly basis.
The BTC/USD pair opened the new trading period on Monday by making a step up to $9,791. Bulls managed to keep the price of the leading cryptocurrency above the major support zones, looking for a break of the indicator cluster zone near at $9,900-$10,000.
The next target on the chart naturally was the mid-term diagonal resistance, followed by the horizontal resistance area.
On Tuesday, June 9, bitcoin remained flat, hovering around the already mentioned levels.
The mid-week session on Wednesday saw BTC fall as low as $9,600 in the early hours before hitting $10,00 in the evening. It closed the day with an increase to $9,900, right at the dynamic resistance.
On Thursday, June 11, the BTC/USD pair suffered a sharp drop to $9,260. The coin lost 6.4 percent of its value and fell as low as $9,067 during intraday, hitting the long-term downtrend resistance line. It lost both the horizontal support zone around $9,500 and the mid-term uptrend.
The Friday session was a good one for bulls as they avoided breaking the psychological $9,000 level and moved up to $9,462 instead. Here, however, they faced a double resistance in the form of the $9,500 horizontal line and the already-mentioned diagonal trend.
The weekend of June 13-14 started with a flat trading on Saturday. Then on Sunday, bitcoin made a pullback to $9,327 as it continued to struggle to regain positions above the important mid-term and long-term targets, which indicated an extremely heavy pressure from sellers.
ETH/USD
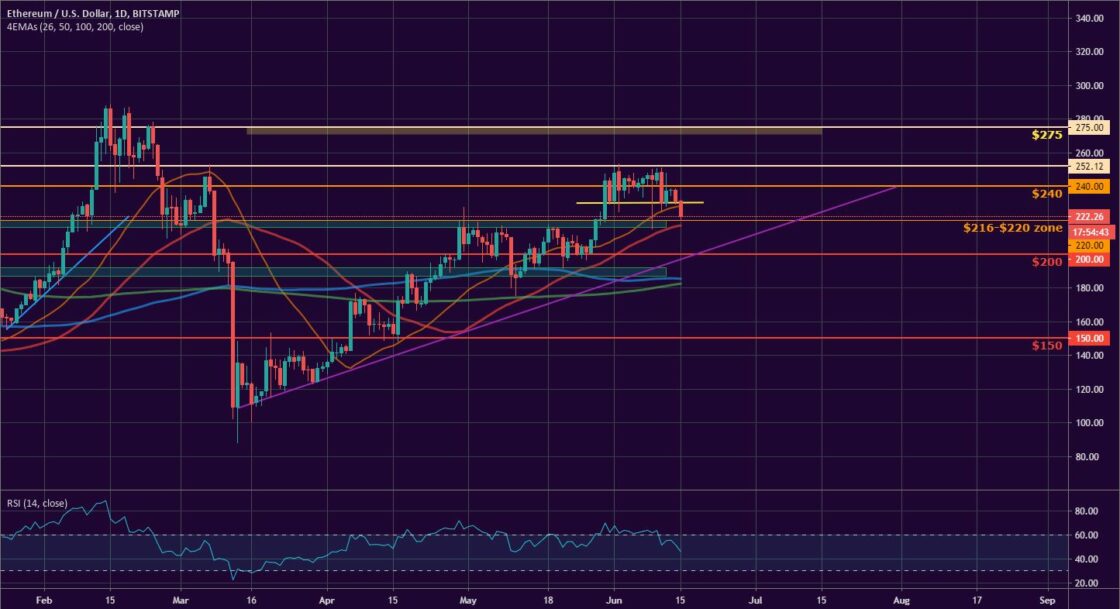
The Ethereum Project token ended the previous trading week at $244 after adding $2 to its value on Sunday, June 7. The coin dropped as low as $233 during intraday, but recovered in the evening, keeping the support line. It was 2 percent down for the seven-day period.
On Monday, the ETH/USD pair extended gains to $247 and continued its way up towards the next targets – $250-$252.
The session on Tuesday, June 9 was all bears. The extreme pressure they put on “ether” resulted in a flash crash to $215. It was the solid support zone near $216-$220 that provided the required stability for the coin to recover in the evening. It still closed with a small loss to $244.
The third day of the workweek came with a recovery to $248 and a short green candle up.
On Thursday, June 11, the ETH/USD pair followed the example of BTC and moved lower. It lost 7 percent after reaching the next support level down at $230.
The coin formed a short green candle on Friday and partially recovered from the loses stopping at $237. It remained flat on the first day of the weekend and on Sunday, June 14 once again tested the $230 support and closed at $231.
The next target in front of bulls was to retake and consolidate above the $240 mark.
XRP/USD
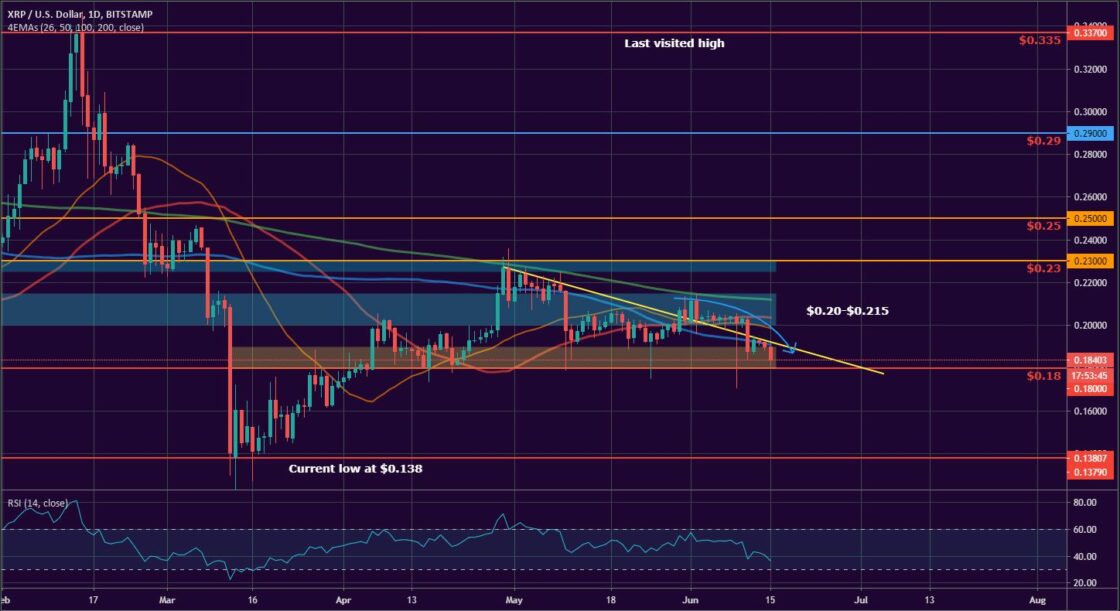
The Ripple company token XRP hit the diagonal support at $0.198 during intraday on Sunday, June 7, but then managed to recover in the evening and closed flat at $0.203. It was less than percent down on a weekly basis.
The new trading period started with a somehow volatile session on Monday. The major altcoin was moving in the $0.2045 – $0.201 range before closing above the 50-day EMA at $0.204.
On Tuesday, June 9, the XRP/USD pair dropped like a rock and hit $0.17 in the early hours of trading. The flash crash, however, was short-lived and the coin recovered in the evening, closing with a short red candle to $0.201.
The mid-week trading session on Wednesday was more positive for bulls as they pushed the price of XRP up to $0.202 and avoided further decline below the critical support level at $0.20.
On Thursday, June 11, however, the entire cryptocurrency market experienced a big correction, which resulted in a drop to $0.188 for the “ripple” and a loss of 7 percent.
The last day of the workweek saw price jumping up to $0.193, surpassing the horizontal resistance at $0.19 and the 100-day EMA. Unfortunately for buyers, the XRP/USD pair was already trading back below the mid-term downtrend line, which once again proofed to be a solid obstacle in front of them.
The weekend sessions demonstrated the consistency of the diagonal resistance. First on Saturday, June 13, the XRP fell to $0.192 after it failed to break the mentioned line. Then on Sunday the altcoin continued to slide and closed at the $0.19 mark.
Altcoin of the Week
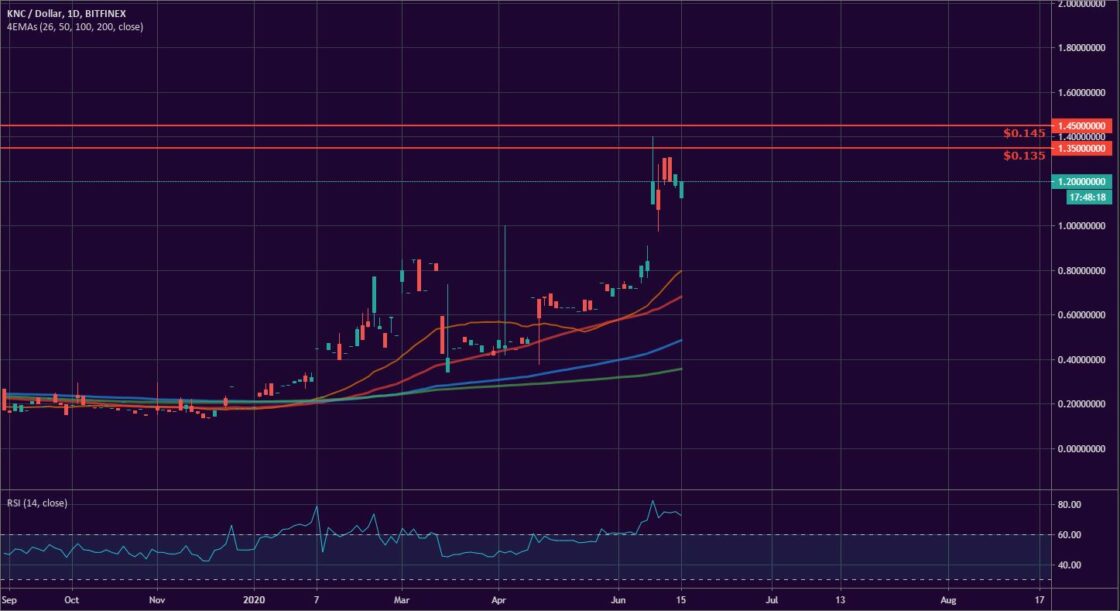
Our altcoin of the week is Kyber Network (KNC). This well-known cryptocurrency project is often described as an “on-chain liquidity protocol” that focuses on token swaps and payment processing services on the blockchain as well as financial dApps.
KNC added 62 percent to its value for the last seven days and is also 75 percent up for two-week period. The coin peaked at $1.30 on Friday, June 12 and moved up to #39 on the CoinGecko’s Top 100 list with a market capitalization of approximately $221 million.
The reason for the surge is not known, but on June 8 the team behind the coin release their Kyber Ecosystem Report #15, which outlined the significant progress made on the KNC network in the past few months and improved overall stats.
As of the time of writing, the token is trading at $1.2 against USD on the Bitfinex platform. Next targeted levels up are $1.35 and $1.45.
Like BTCMANAGER? Send us a tip!
Our Bitcoin Address: 3AbQrAyRsdM5NX5BQh8qWYePEpGjCYLCy4


