

The total crypto market cap added $33.5 billion to its value for the last seven days and now stands at $306.2 billion. The top 10 currencies were mostly in green for the same period with ether (ETH) and Litecoin (LTC) leading the pack with 35.5 and 14.3 percent of increase respectively . By the time of writing bitcoin (BTC) is trading at $10,224 while ether (ETH) is skyrocketed $342. Ripple’s XRP climbed up to $0.216.
BTC/USD
Bitcoin closed the trading session on Sunday, July 19 with a third consecutive green candle on the daily chart. The coin moved up to $9,211 and for the fourth straight session attempted to break above the diagonal line that acted as a mid-term support level since May 11. It closed the seven-day period with a less than one percent of decline.
The BTC/USD pair started the new trading period on Monday with a short pullback to $9,160.
On Tuesday, July 21, the leading cryptocurrency skyrocketed to $9,390 in its best session since July 6. The move resulted in breaking both the horizontal resistance at $9,300 and the 50-day Exponential Moving Average (EMA). BTC regained its positions in the uptrend corridor and added 2 percent to its value.
Bulls continued with their good performance during the mid-week session on Wednesday and extended the gains up to $9,535, surpassing the lower-end of the $9,600-$9,500 S/R zone for the first time since June 22.
On Thursday, July 23, the BTC/USD pair finally surpassed the $9,600 resistance line and closed the day at $9,616. This was its third-straight day in green.
The last trading session of the workweek came with a small red candle to $9,550. The correction was most probably caused by price-taking activities as some long positions were closed around the already-mentioned level.
The weekend of July 25-26 started with a continuation of the uptrend and bitcoin climbed to $9,712 on Saturday.
On Sunday, it followed the example of ETH, which was the top performer amongst the Top 10 cryptocurrencies and climbed up to $9,943 after breaking above $10,000 in the early hours of trading.
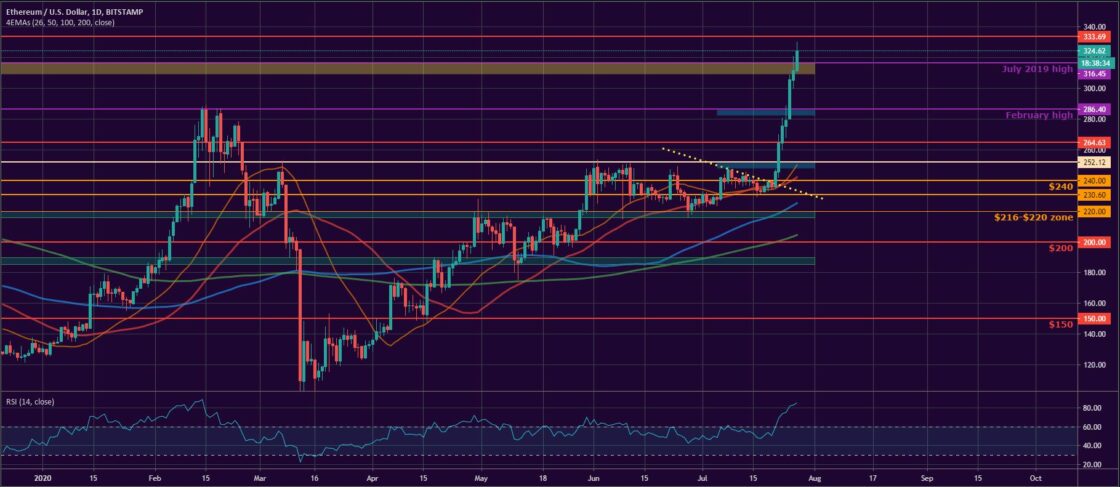
ETH/USD
The Ethereum Project token ETH moved up to $240 on Sunday, July 19 and reached the meeting point of the diagonal and horizontal resistances. The coin was 1.2 percent down on a weekly basis.
On Monday, the ETH/USD pair formed a similar candle on the daily chart, but in the opposite direction, correcting its price down to $235 after suffering a rejection near the above-mentioned lines.
The trading day on Tuesday was quite a good one for buyers as the price of ETH broke above the diagonal and horizontal resistances and climbed all the way up to $245 for the first time in two weeks. The ether added 4.3 percent to its value.
The uptrend was continued on Wednesday, July 22 when the leading altcoin reached its highest point since February and closed the day at $264 after touching $270 during intraday.
On Thursday, the ETH/USD pair formed its third consecutive green candle on the daily chart and extended its gains up to $275, successfully reaching the next major resistance line.
That level was surpassed on Friday, July 24 when the coin climbed to $280 after moving in the $290 – $265 area during intraday.
The crypto market was rising fast and ETH was the main driving force. On the first day of the weekend, it made an unprecedented move by printing a new year to date high at $306 – its highest point since July 2019. ETH was 9.2 percent up for the day.
The Sunday session was as impressive as the previous one. The ether continued to rise and reached $311 after trading as high as $321 at some point during the day.
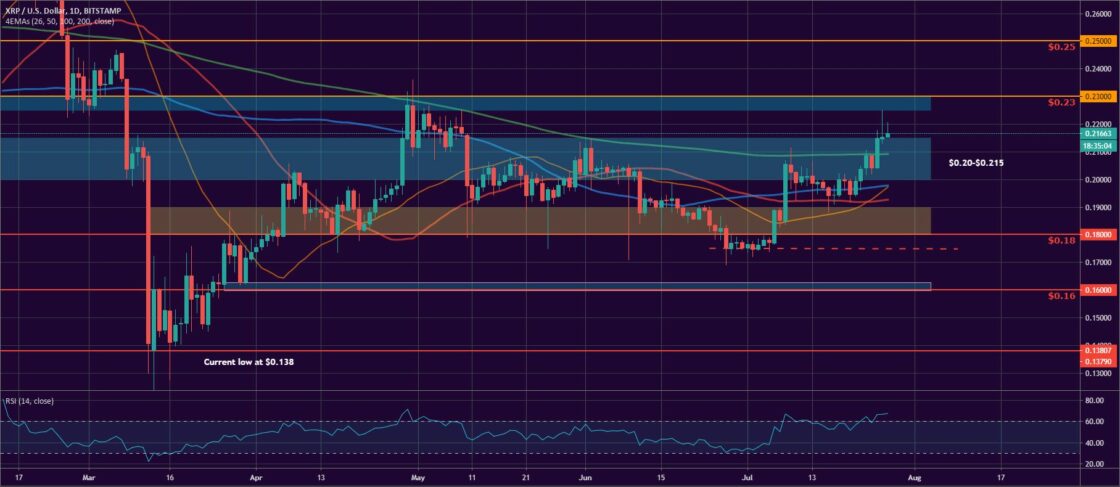
XRP/USD
The Ripple company token XRP was rejected at the horizontal resistance near $0.20 on Sunday, July 19, and closed the day at $0.199 after a highly volatile session, during which the coin was trading in the $0.201-$0.196 range. It remained flat for the seven-day period.
The XRP/USD pair started to suffer another rejection on Monday, this time near the upper-end of the bull flag pattern formation on the daily chart. The move resulted in a 2.5 percent price correction, down to $0.194.
On Tuesday, July 21, the “ripple” formed the exact same candlestick, but in the opposite direction, regaining positions near the $0.20 major resistance line.
The mid-week session on Wednesday was a breakthrough moment for XRP as buyers were able to push the price up to $0.203 and initiated a reversal to the upside. The coin added another 1.5 percent.
On Thursday, July 23, the major altcoin hit the 200-day Exponential Moving Average and closed the day at $0.208 in its third consecutive day of gains.
The last day of the workweek came with a small pullback as price-taking activities were taking place after the recent surge in the XRP price. It stopped at $0.204, still trading in the S/R area.
The weekend of July 25-26 started with an unexpected price jump to $0.215. The XRP/USD pair climbed up to the upper end of the resistance zone and grew by 5.3 percent.
On Sunday, it started to lose momentum but still managed to form a small green candle to $0.2153, but not before hitting the next resistance level at $0.225.
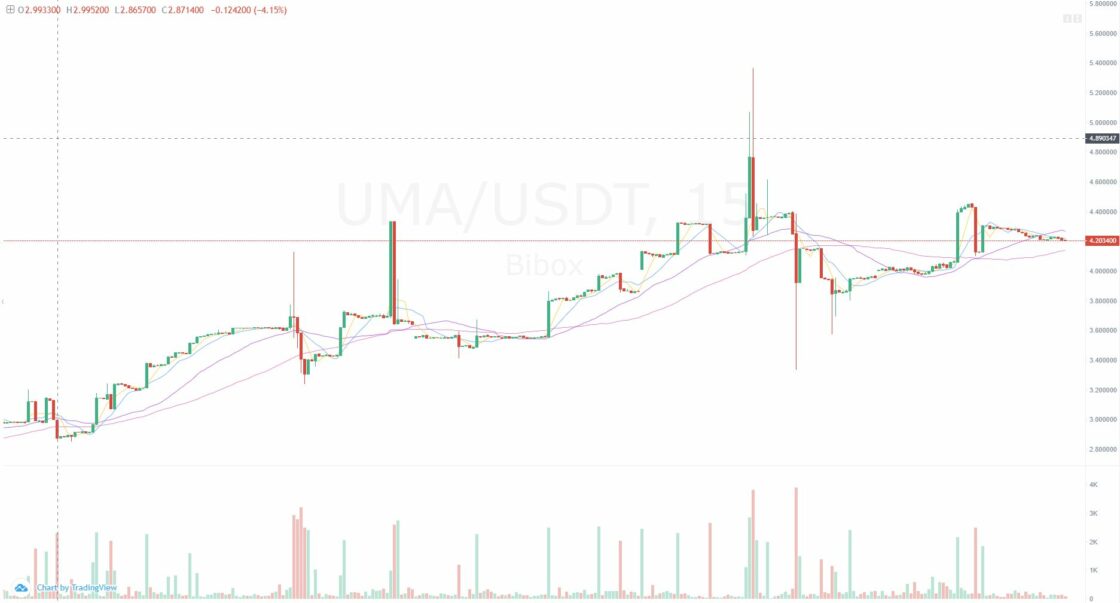
Altcoin of the Week
Our Altcoin of the week is UMA (UMA). Universal Market Access is a decentralized finance platform that is mainly aimed at bringing traditional financial derivatives to the blockchain by implementing a series of financial contract creation innovations and fully utilizing the power of synthetic tokens.
Uma grew by 120 percent for the last seven days and is currently ranked at #51 on CoinGecko’s Top 100 list. The coin peaked at $4.44 on Sunday, July 26, and is now with a total market capitalization of approximately $223 million.
As of the time of writing, UMA is trading at $4.204 against USDT on the Bibox exchange.
Like BTCMANAGER? Send us a tip!
Our Bitcoin Address: 3AbQrAyRsdM5NX5BQh8qWYePEpGjCYLCy4

