

In a detailed analysis, crypto analyst Egrag has forecasted a remarkable 2450% rise in the XRP price, citing a bullish crossover in the 2-week XRP market cap chart, where the 21 Exponential Moving Average (EMA) has exceeded the 55 Moving Average (MA). This pattern is typically seen as a precursor to substantial price increases.
Egrag, through a post via X, emphasized the significance of this development: “XRP CONFIRMED KABOOM: […] On the 2-Week Time Frame, we’ve witnessed an exciting development as the 21 EMA has crossed over the 55 MA. This bullish crossover historically signifies the onset of significant price explosions.”
Bullish Crossover Heralds Massive XRP Price Surge
The analysis highlights two previous instances where similar patterns led to significant price movements. The first, referred to as “Kaboom A,” occurred between early 2015 and early 2017. During this phase, XRP’s market capitalization varied between $142.642 million and $349.476 million. Following the bullish crossover of the 21 EMA over the 55 EMA in the 2-week chart, XRP’s market cap experienced a significant rise, breaking through the 1.618 Fibonacci extension level at $2.592 billion and peaking at over $126 billion in January 2018.
From December 2020 to April 2021, there was a shorter cycle. Again, a bullish crossover of the 21 EMA above the 55 MA in the 2-week chart was seen initially. As a result, the XRP market capitalization rose from $.7.67 billion to over $88 billion (and with it the price to $1.96)
In the current “confirmed KABOOM Cycle”, XRP’s market cap is hovering above the $35.235 billion mark, which again equates to the 0.5 Fibonacci level. At press time, it stood at $37.516 billion.
Delving into the current situation, Egrag explained:
Notably, in the previous ‘Kaboom A’ phase, the Fib 0.5 level acted as a clear launch pad. In the current ‘Confirmed KABOOM Cycle,’ XRP’s Market Cap is once again rebounding from Fib 0.5, hinting at an imminent ‘Kaboom Cosmic Ignition.’
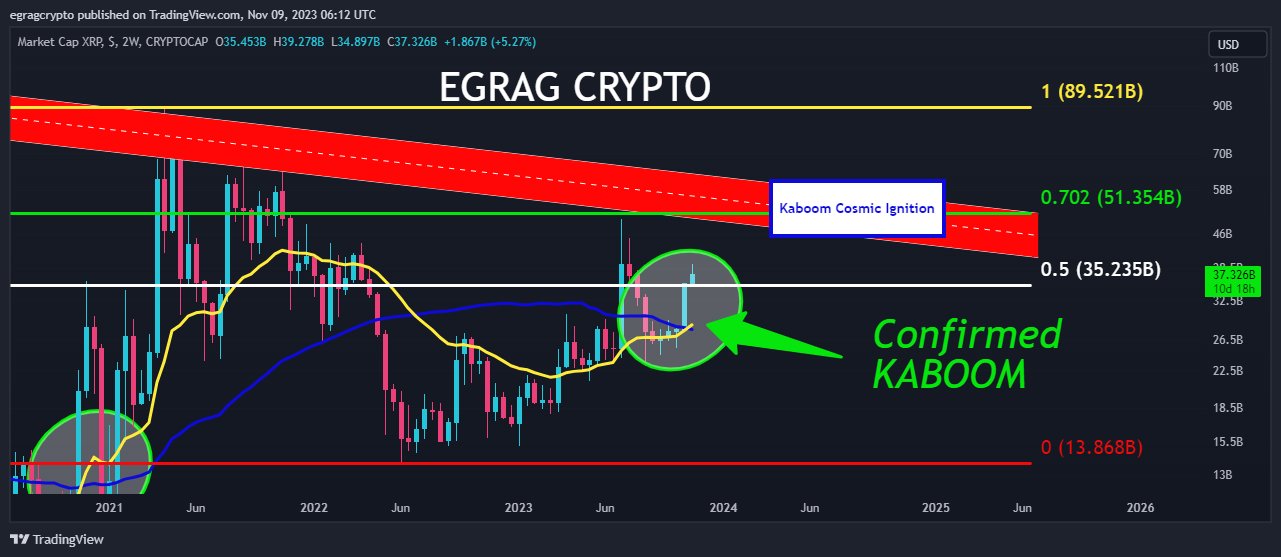
However, XRP’s market capitalization is currently facing several key levels. Egrag emphasizes the critical nature of the $51.3 billion market cap, which coincides with the 0.702 Fibonacci level. A close above this threshold on the 2-week chart could trigger a significant rally for XRP, or as Egrag puts it: “XRP closing above the $51.3 billion Fib 0.702 level could be the watershed moment for our victory.”
Remarkably, Egrag highlights another crucial resistance level in his chart, a descending trend line (dashed red line) that has formed since the peak in January 2018. According to Egrag, a breakout above this level could trigger a rally of more than 2450% (from the current market cap and price).
The final target for the XRP market cap could be the 1,618 Fibonacci extension level at $283.489 billion and the 2,618 Fibonacci extension level at $959.663 billion. The latter would translate to an XRP price of $17.94.
Questions From The Community
In response to questions from the community, Egrag explained the significance of the $51.3 billion level: “This is a macro resistant range, because closing multiple weekly candles above this range means u will never see XRP below this price or in cents, we will see XRP price only in dollars.”
When inquired about the likelihood of another price test prior to an increase, Egrag conceded, “Possible but it will be a wicking process while we are sleeping,” suggesting that any pullbacks could be short-lived.
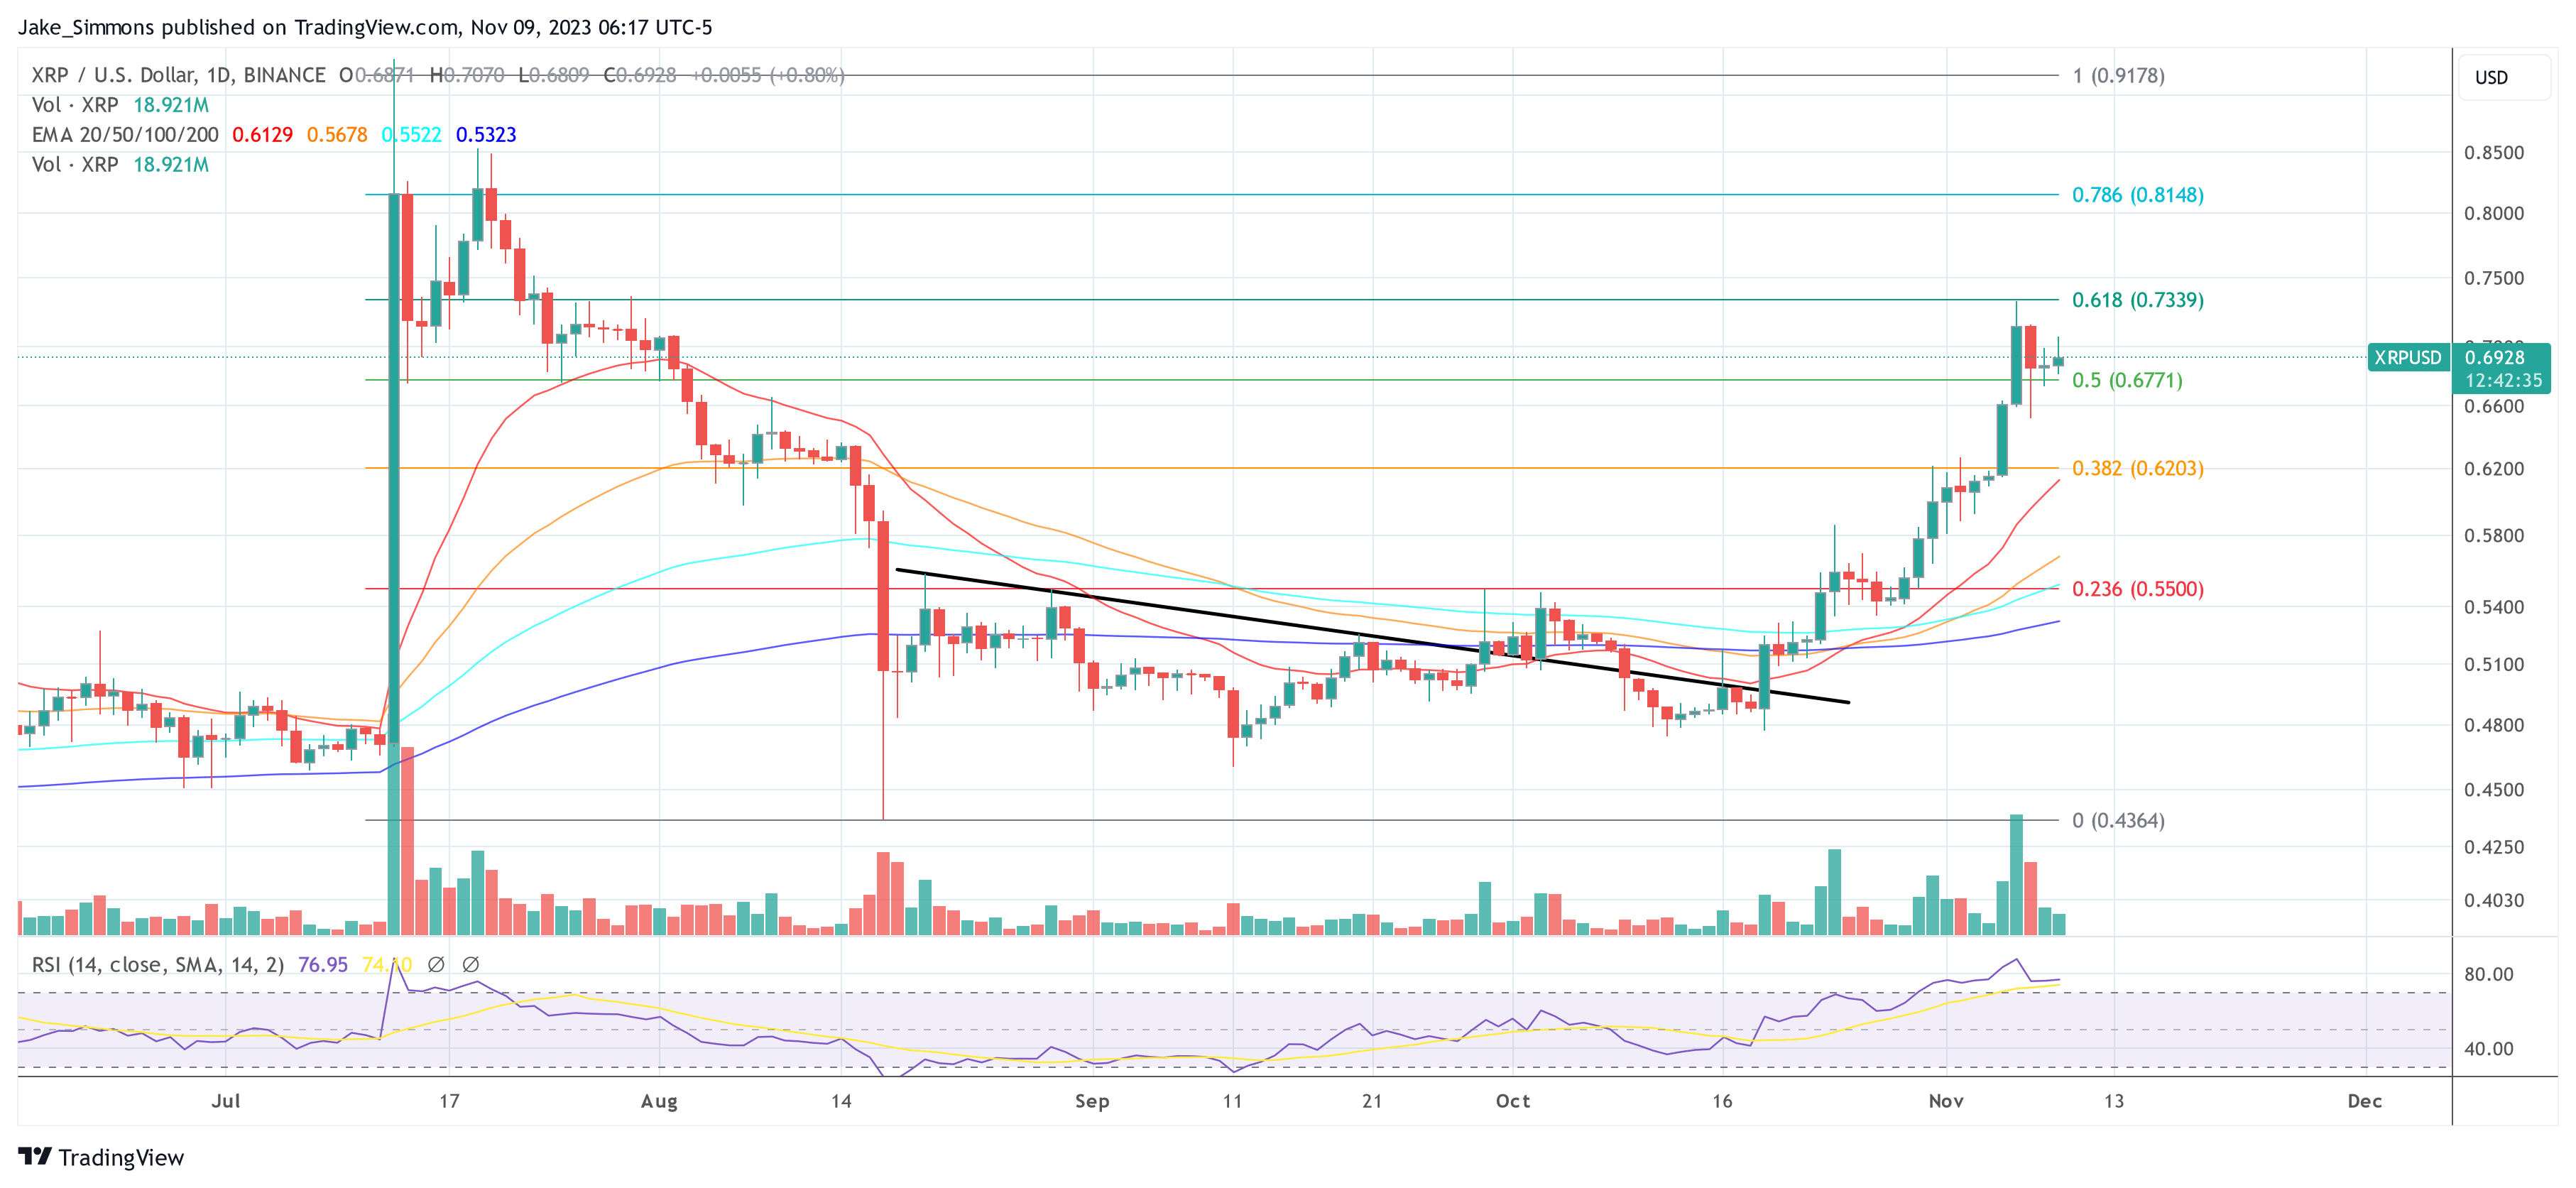
At press time, XRP traded at $0.6928.
Featured image from Kanchanara / Unsplash, chart from TradingView.com

