

Ripple climbed above $0.2800, but it failed to continue above $0.2860 against the US Dollar. XRP price is currently declining towards the key $0.2700 and $0.2650 support levels.
- Ripple price topped near the $0.2860 level and declined recently against the US dollar.
- The price is now trading below the $0.2800 level, but there are still many supports on the downside.
- There was a break below a key bullish trend line with support near $0.2760 on the hourly chart of the XRP/USD pair (data source from Kraken).
- The price is likely to find a strong buying interest near $0.2700 or $0.2650.
Ripple Price Could Bounce Back
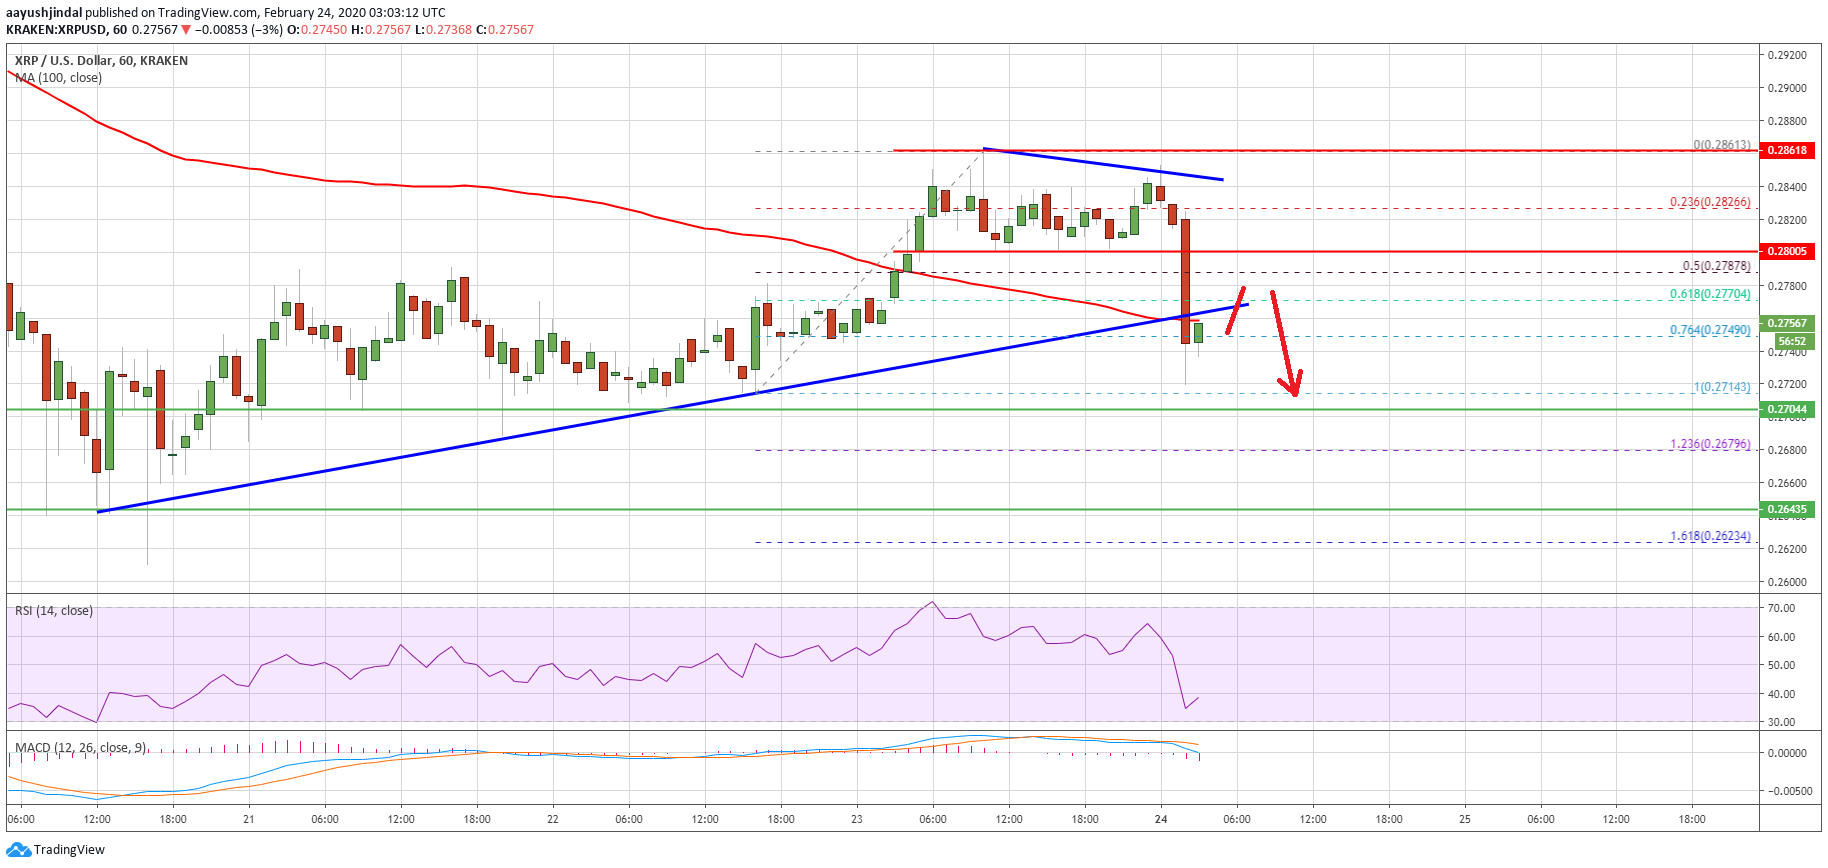
Recently, there was a steady increase in ripple from the $0.2650 support area. XRP price broke the $0.2800 resistance area and the 100 hourly simple moving average.
However, the bulls failed to lead the price toward the $0.3000 resistance. A swing high is formed near $0.2861 and the price recently started a fresh decline. It traded below the $0.2800 and $0.2780 levels to move into a short term bearish zone.
Besides, there was a break below a key bullish trend line with support near $0.2760 on the hourly chart of the XRP/USD pair. The pair even declined below the 50% Fib retracement level of the upward move from the $0.2714 low to $0.2861 high.
Ripple is now trading well below the $0.2780 level and the 100 hourly simple moving average. It is testing the 76.4% Fib retracement level of the upward move from the $0.2714 low to $0.2861 high.
On the downside, there are many supports near the $0.2700 and $0.2650 levels. On the upside, the 100 hourly SMA is an initial hurdle near $0.2760. The first key resistance is seen near the $0.2800 level, above which the bulls are likely to gain strength. In the mentioned case, the price could rise further towards $0.3000.
More Downsides?
If ripple fails to climb back above $0.2800, it could slide below the $0.2700 support. The next key support is near the $0.2650 and $0.2640 levels. An intermediate support is near the $0.2680 level since it is the 1.236 Fib extension of the upward move from the $0.2714 low to $0.2861 high.
Overall, there could be a downside extension in the short term, but the price is likely to bounce back from $0.2700 or $0.2650.
Technical Indicators
Hourly MACD – The MACD for XRP/USD is currently gaining pace in the bearish zone.
Hourly RSI (Relative Strength Index) – The RSI for XRP/USD is now well below the 50 level, with a bearish angle.
Major Support Levels – $0.2700, $0.2680 and $0.2650.
Major Resistance Levels – $0.2800, $0.2860 and $0.3000.


