

Reason to trust
Strict editorial policy that focuses on accuracy, relevance, and impartiality
Created by industry experts and meticulously reviewed
The highest standards in reporting and publishing
Strict editorial policy that focuses on accuracy, relevance, and impartiality
Morbi pretium leo et nisl aliquam mollis. Quisque arcu lorem, ultricies quis pellentesque nec, ullamcorper eu odio.
In a newly published chart analysis, crypto analyst Egrag (@egragcrypto) posits that XRP may be on the cusp of a significant price breakout reminiscent of its previous cycle peaks. The data, which spans from late 2013 through 2025, highlights multiple instances in which XRP went through a protracted bear market before staging an explosive rally. Two particular examples stand out in Egrag’s assessment: the 2017 surge in which XRP rose over 2,700% from its pre-rally price levels, and the 2021 run-up that saw the asset climb by more than 1,000%.
Egrag Predicts XRP Surge To $19–$45
The chart reveals a consistent framework that relies on the interplay between the 21-week Exponential Moving Average (EMA) and the 33-week Simple Moving Average (MA). These moving averages are shown crossing during bearish cycles and then eventually curving upward, implying the formation of a bottom.
Related Reading
Historically, XRP’s final bullish legs—often culminating in “blow-off tops”—began once the price retook the 21 EMA and the 33 MA, with the 777-day (and in one instance, 770-day) window before those bullish crosses recurring as a noteworthy time cycle. “Men lie, women lie, but charts don’t,” says Egrag. “I’m not improvising here; I’m relying on historical data to present future predictions. Will it rhyme exactly? No, because if it were that easy, everyone would be a multimillionaire!”
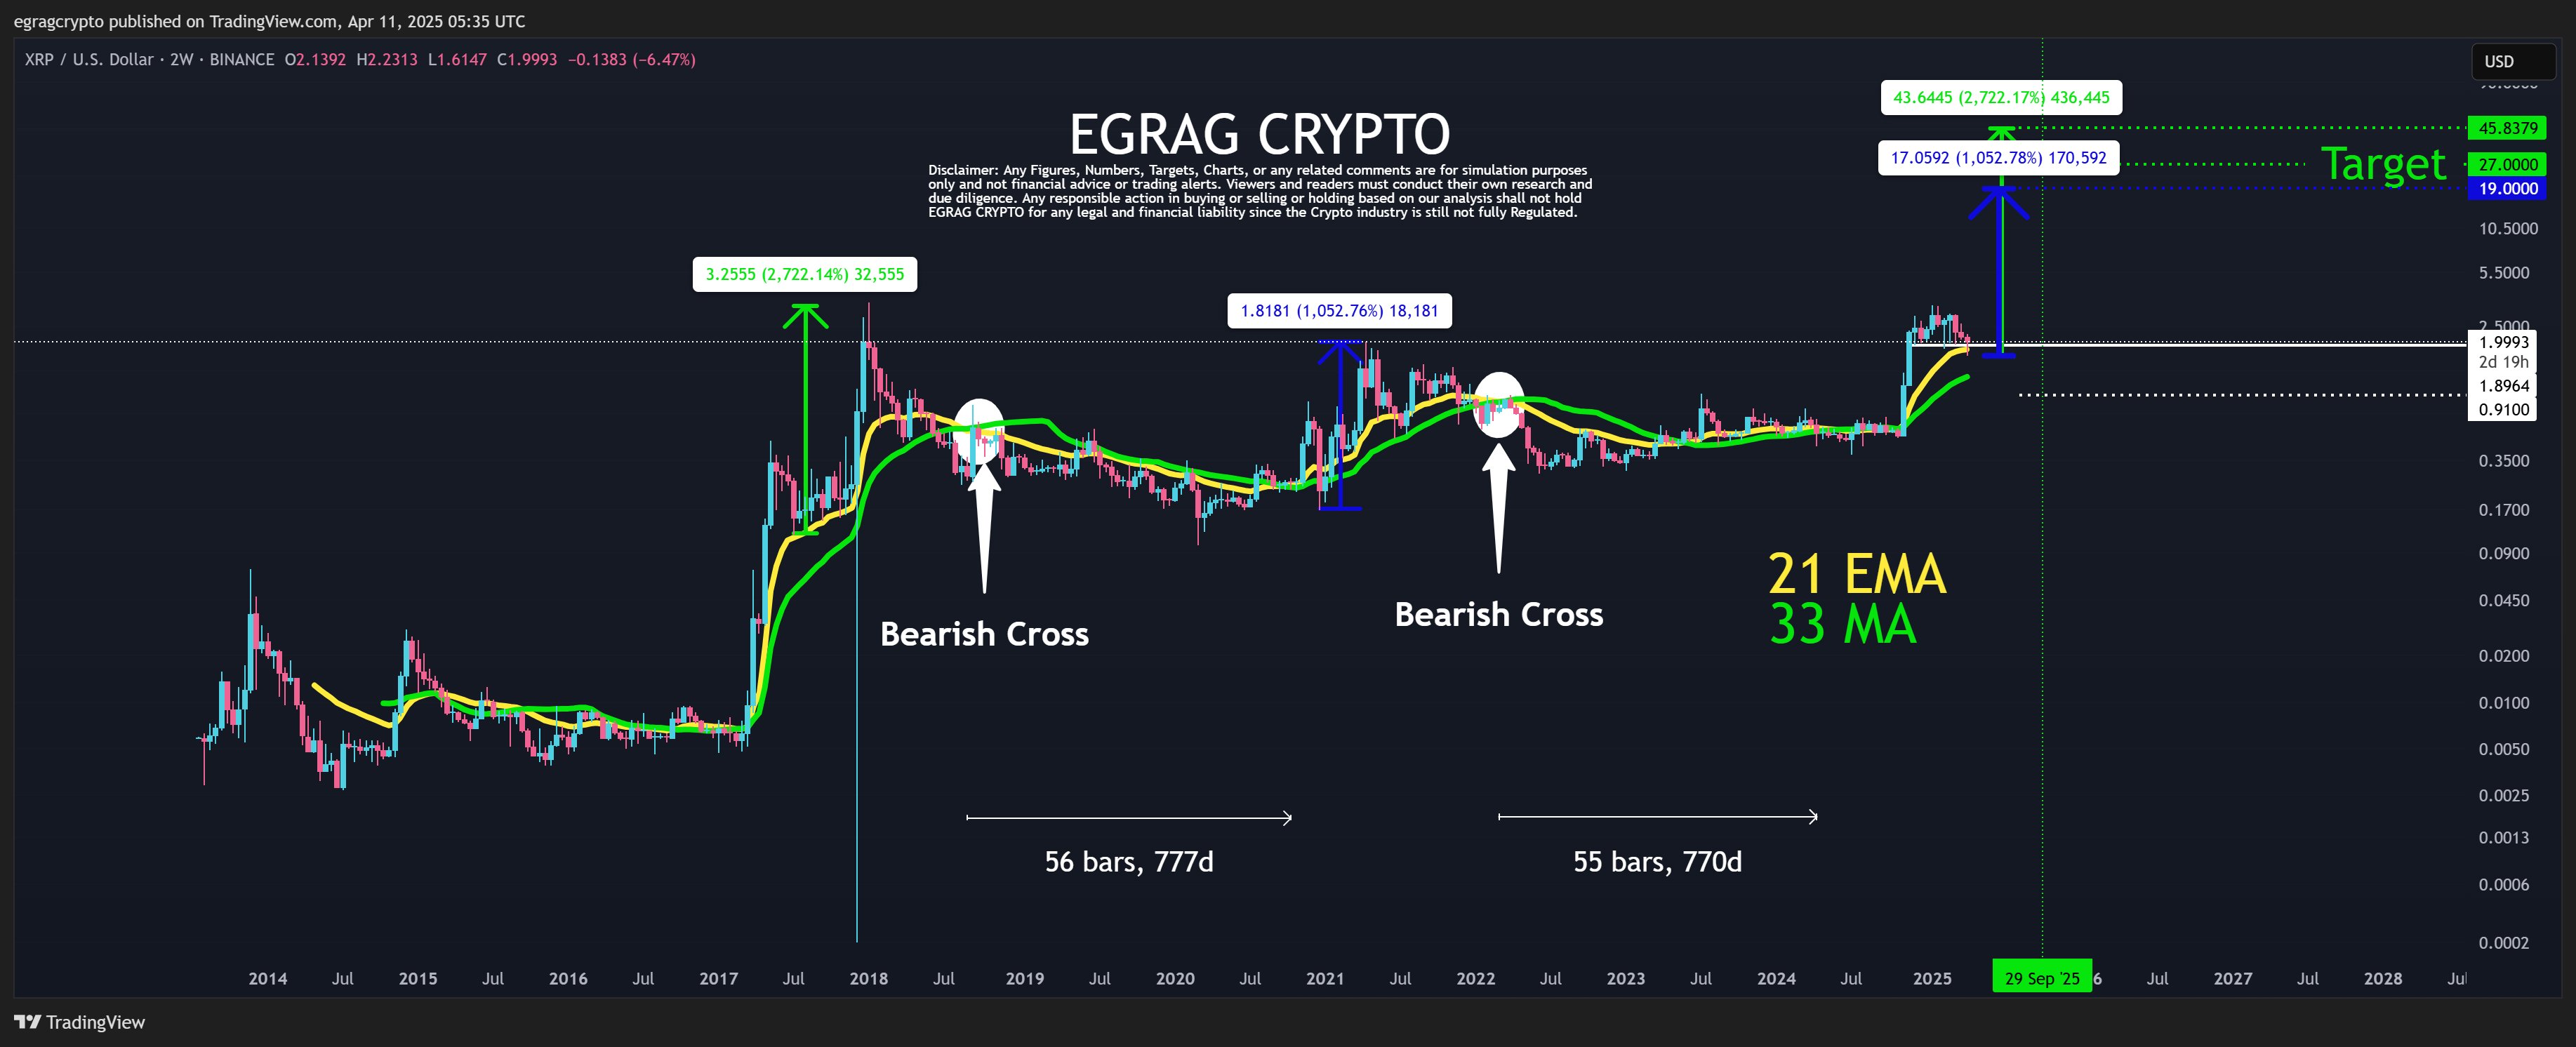
According to the chart, XRP has already mirrored some of the patterns seen in 2017 and 2021, a parallel that leads Egrag to posit two potential price targets if the token completes another blow-off top scenario. While he acknowledges various complicating factors, the analyst believes XRP could rally as much as 2,700%—taking the asset to approximately $45—or, in a more moderate iteration, 1,050% to just below $20. “Now, here’s my measured move: if #XRP mimics either of these cycles, we could see price movements of 2,700% or 1,050%, putting XRP around $45 or $19!” he notes, referencing the previous explosive expansions.
Egrag cites past cycles to support these targets, pointing to how XRP found support at the 21 EMA in 2017 just before launching into its last blow-off phase. In 2021, the coin rallied once it decisively broke above both the 21 EMA and 33 MA.
Related Reading
To underscore the method behind using both indicators, Egrag adds that “market makers use the same moving averages to see where support and resistance are and act against us. So I am using different moving averages—one is fast (exponential) and one is simple—to understand price action better.” He emphasizes these signals are lagging indicators but can still confirm whether market sentiment is shifting from bearish to bullish.
Notably, Egrag’s personal long-standing target for XRP has been $27. He underlines that nothing is guaranteed, especially in a market characterized by what he calls “human reactions and behaviors.” Quoting a line from the film Margin Call, he explains, “You cannot control it, stop it, or slow it, or even slightly alter it…you have to just react. Make a lot of money if you get it right, or you’ll be left by the side of the road if you get it wrong.” Yet he notes that it is wise to strategize selling—or “DCA (Dollar-Sell-Average)—if circumstances call for it, to mitigate risk.
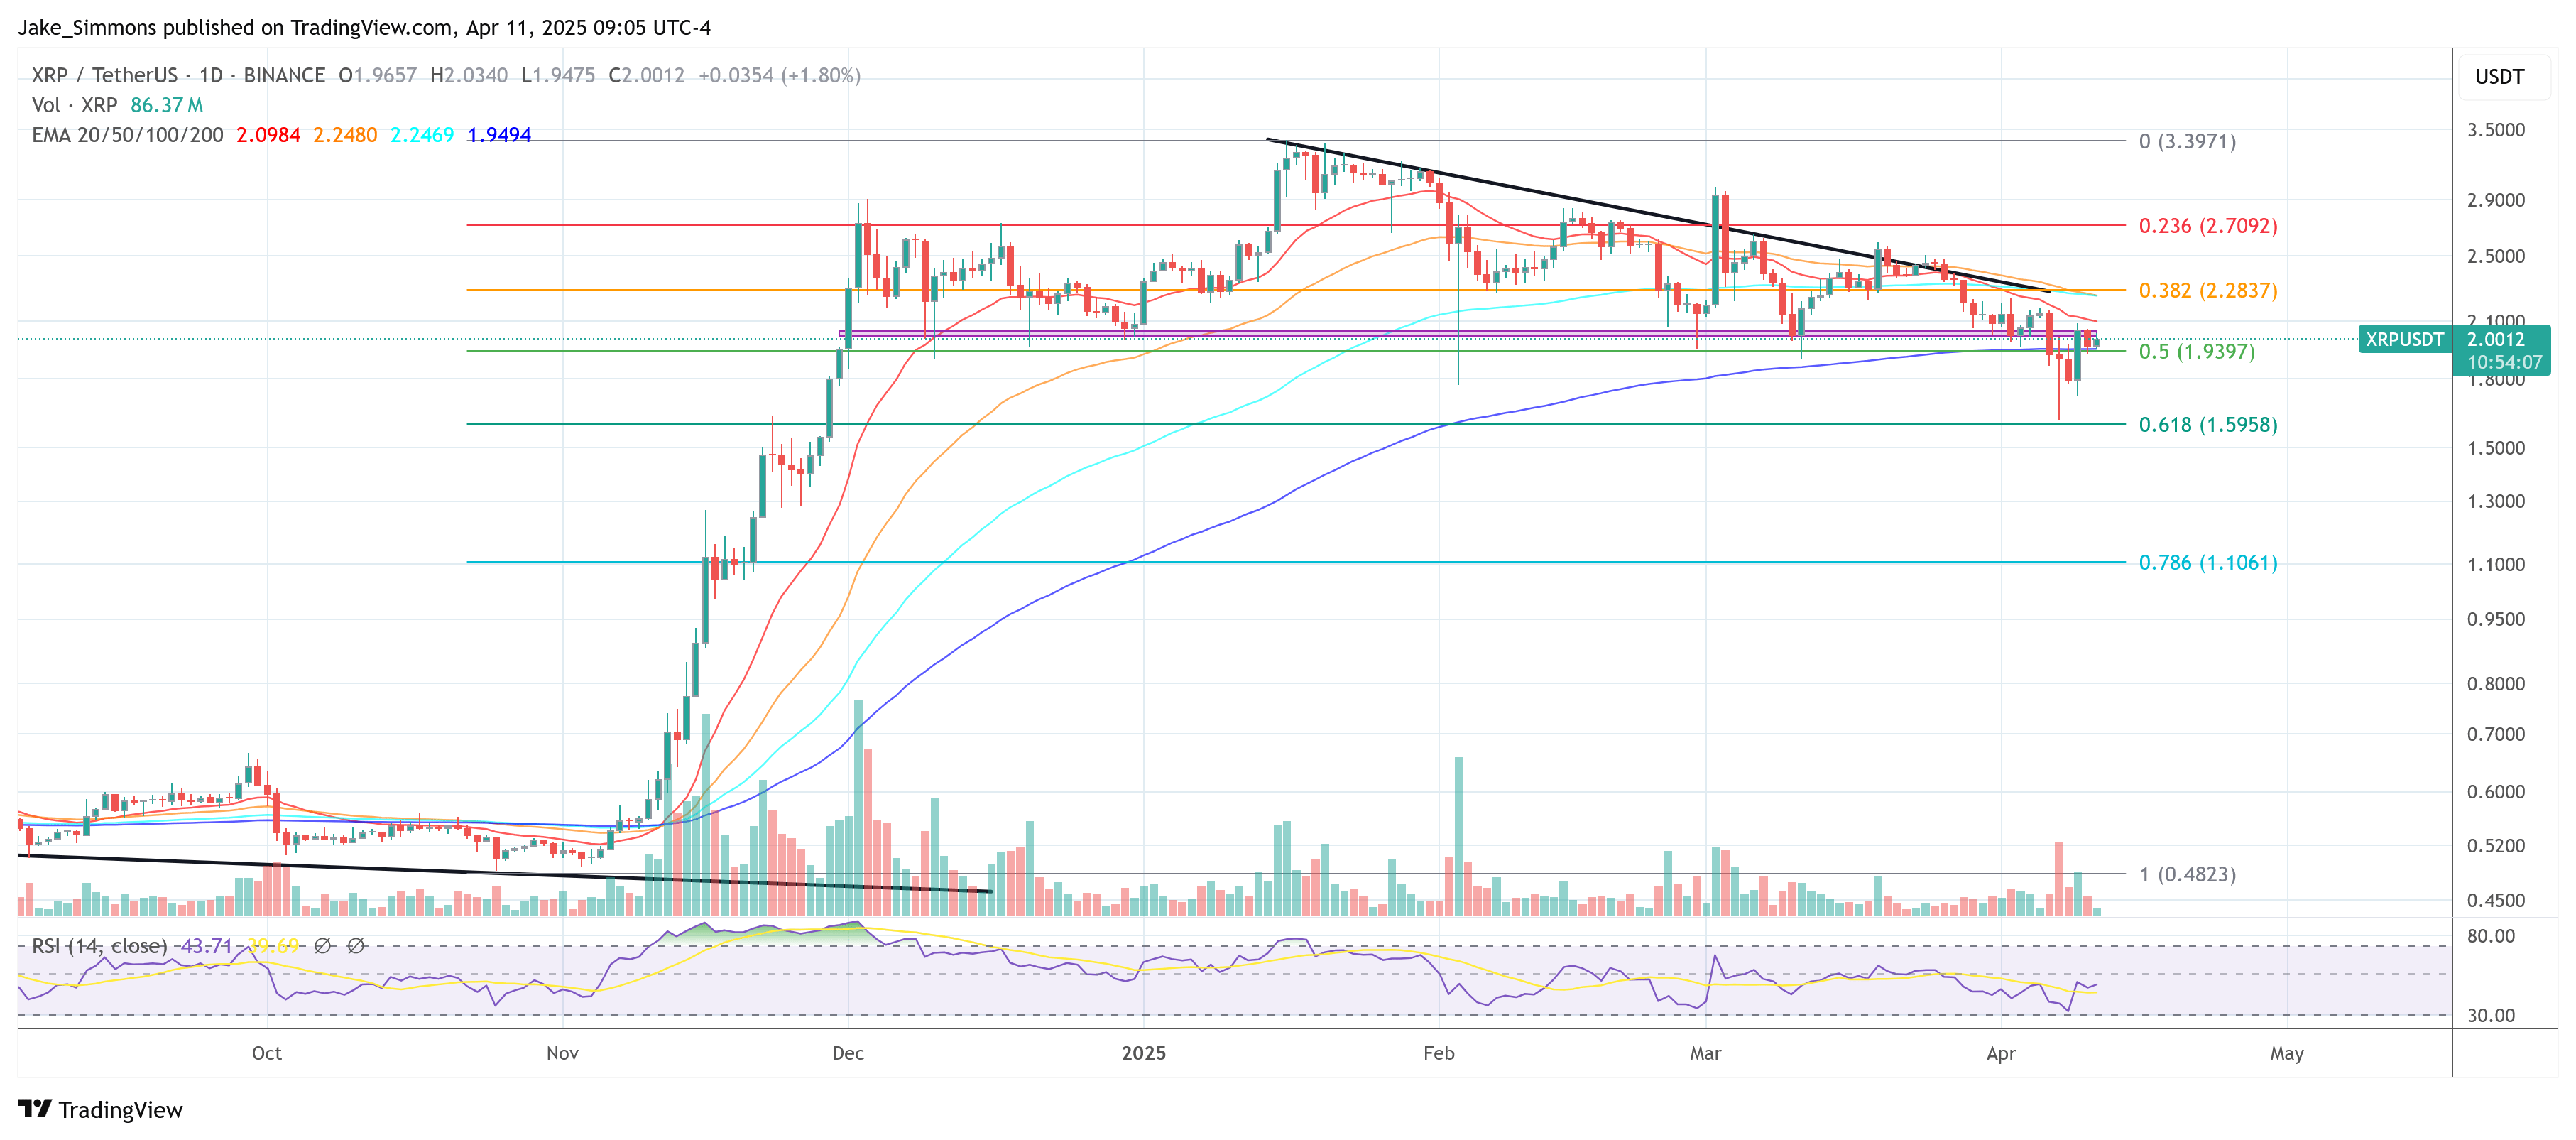
At press time, XRP traded at $2.00.
Featured image created with DALL.E, chart from TradingView.com


