
Ripple’s token price is holding gains above $0.50 against the US Dollar. XRP price could take a hit if it fails to recover above $0.512.
- Ripple’s token price is attempting a fresh increase above $0.508 and $0.512 against the US dollar.
- The price is now trading above $0.500 and the 100 simple moving average (4 hours).
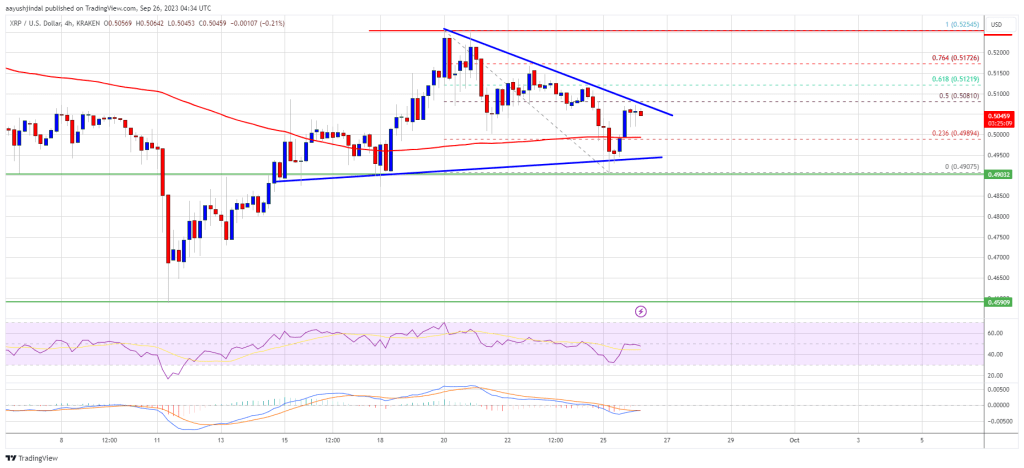
- There is a major contracting triangle forming with resistance near $0.505 on the 4-hour chart of the XRP/USD pair (data source from Kraken).
- The pair might gain bullish momentum if there is a close above $0.512.
Ripple’s Token Price Holds Key Support
In the last XRP price prediction, we discussed the chances of more gains in Ripple’s XRP against the US Dollar. The price did climb above the $0.515 resistance level, but upsides were limited, like Bitcoin and Ethereum.
The price struggled to clear the $0.525 resistance. A high was formed near $0.5254 and the price saw a downside correction. There was a move below $0.512 and a spike below $0.50. A low is formed near $0.4907 and the price is now consolidating.
It is back above the 23.6% Fib retracement level of the recent decline from the $0.5254 swing high to the $0.4907 low. XRP price is also trading above $0.500 and the 100 simple moving average (4 hours).
On the upside, immediate resistance is near the $0.508 level. Besides, there is a major contracting triangle forming with resistance near $0.505 on the 4-hour chart of the XRP/USD pair. The triangle resistance coincides with the 50% Fib retracement level of the recent decline from the $0.5254 swing high to the $0.4907 low.
Source: XRPUSD on TradingView.com
The next major resistance is near the $0.5120 level. A close above the $0.512 level could send the price toward the $0.525 barrier. A successful break above the $0.525 resistance level might start a strong rally toward the $0.555 resistance. Any more gains might call for a test of the $0.580 resistance.
Downside Break in XRP?
If ripple fails to clear the $0.512 resistance zone, it could start another decline. Initial support on the downside is near the $0.50 zone and the 100 simple moving average (4 hours).
The next major support is at $0.490. If there is a downside break and a close below the $0.490 level, XRP’s price could extend losses. In the stated case, the price could retest the $0.460 support zone.
Technical Indicators
4-Hours MACD – The MACD for XRP/USD is now losing pace in the bullish zone.
4-Hours RSI (Relative Strength Index) – The RSI for XRP/USD is now below the 50 level.
Major Support Levels – $0.500, $0.490, and $0.460.
Major Resistance Levels – $0.508, $0.512, and $0.525.

 Token Pre-Sale 100% Sold Out")
