

Bitcoin (BTC) slipped from $27,000 on Sep. 21 as the dust settled on the latest United States macroeconomic events.
Bitcoin: “Rangebound until proven otherwise”
Data from Cointelegraph Markets Pro and TradingView showed BTC price strength waning prior to the Wall Street open, down by around 1.5% on the day.
Bitcoin had delivered a cool reaction to the Federal Reserve’s interest rate pause, and Chair Jerome Powell’s speech and press conference likewise failed to spark major volatility.
Contrary to the expectations of many, BTC price action acted as if no catalysts were present at all. Later, news that payouts to creditors of defunct exchange Mt. Gox had been delayed by a year also went unnoticed by markets.
“The Fed’s announcement of a rate pause caught exactly no-one by surprise,” popular trader Jelle summarized to X subscribers.
“Price is still in the same spot, but at least now we don’t have FOMC hanging over our heads. Rangebound until proven otherwise.”
Jelle’s underlying longer-term roadmap remained bullish, suggesting an exit higher from the current structure, in play for more than a year, was still possible.
#Bitcoin is forming a massive cup & handle pattern below $30k.
Some argue it’s not a valid pattern, while others anticipate a big breakout.
I expect higher prices. What do you think? pic.twitter.com/LIkKZTXBUB
— Jelle (@CryptoJelleNL) September 21, 2023
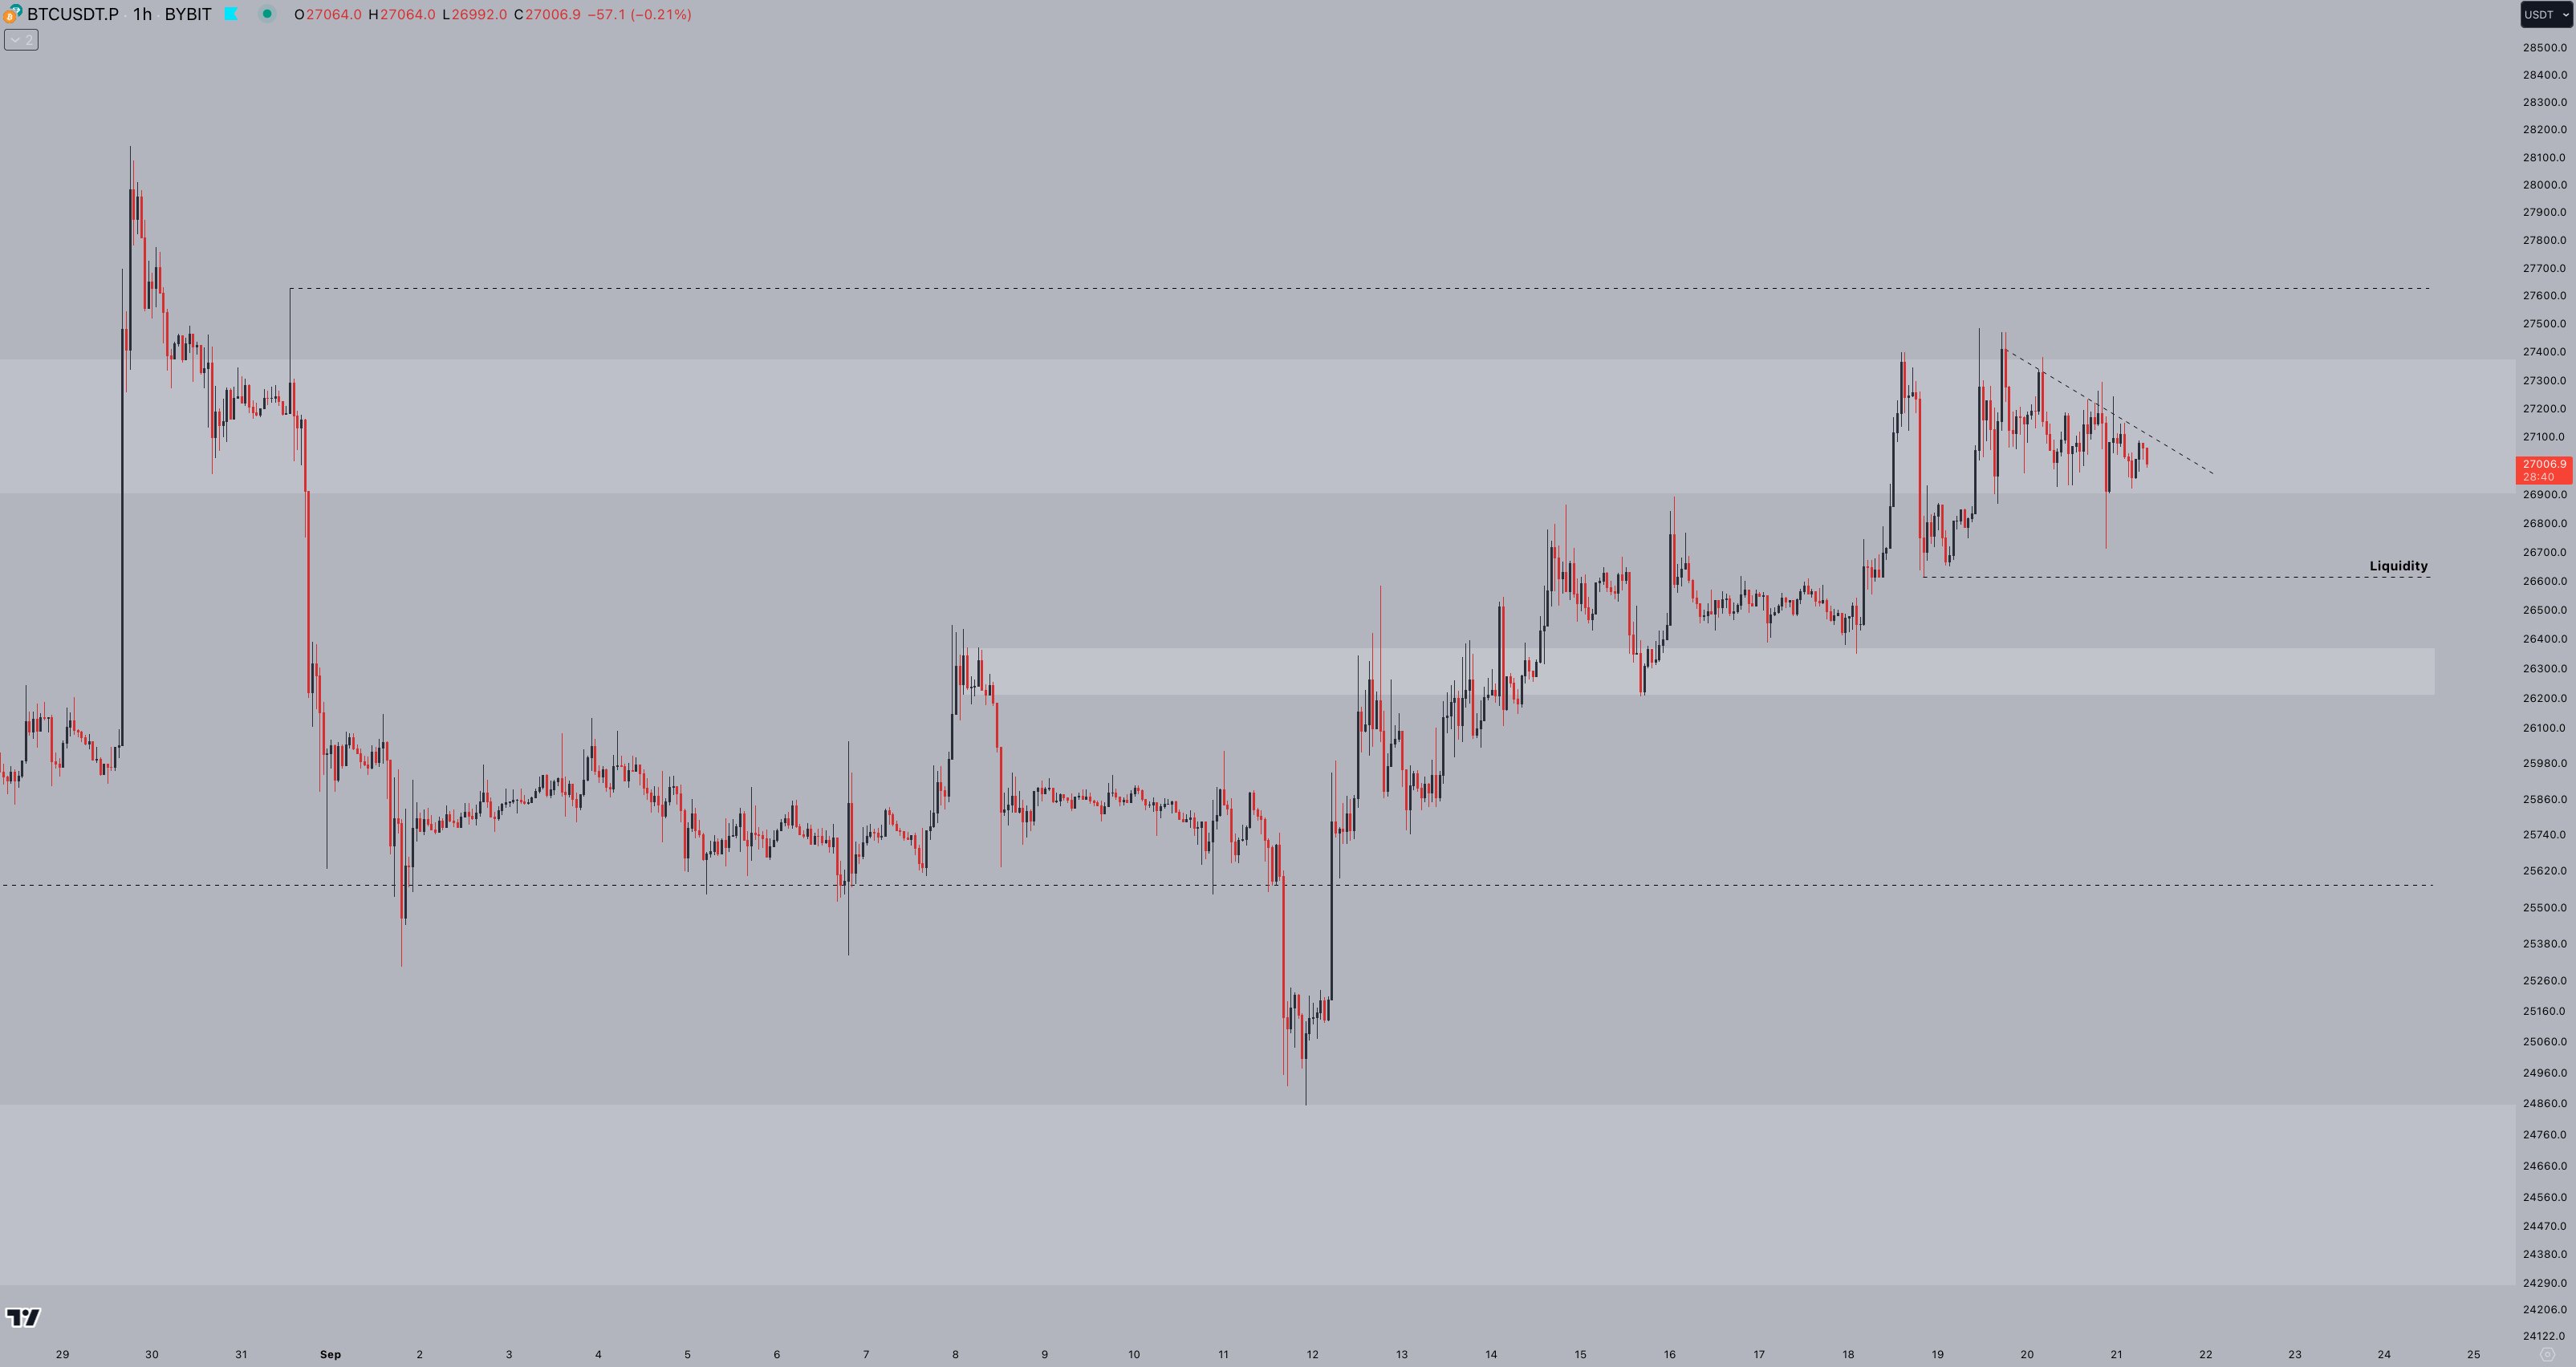
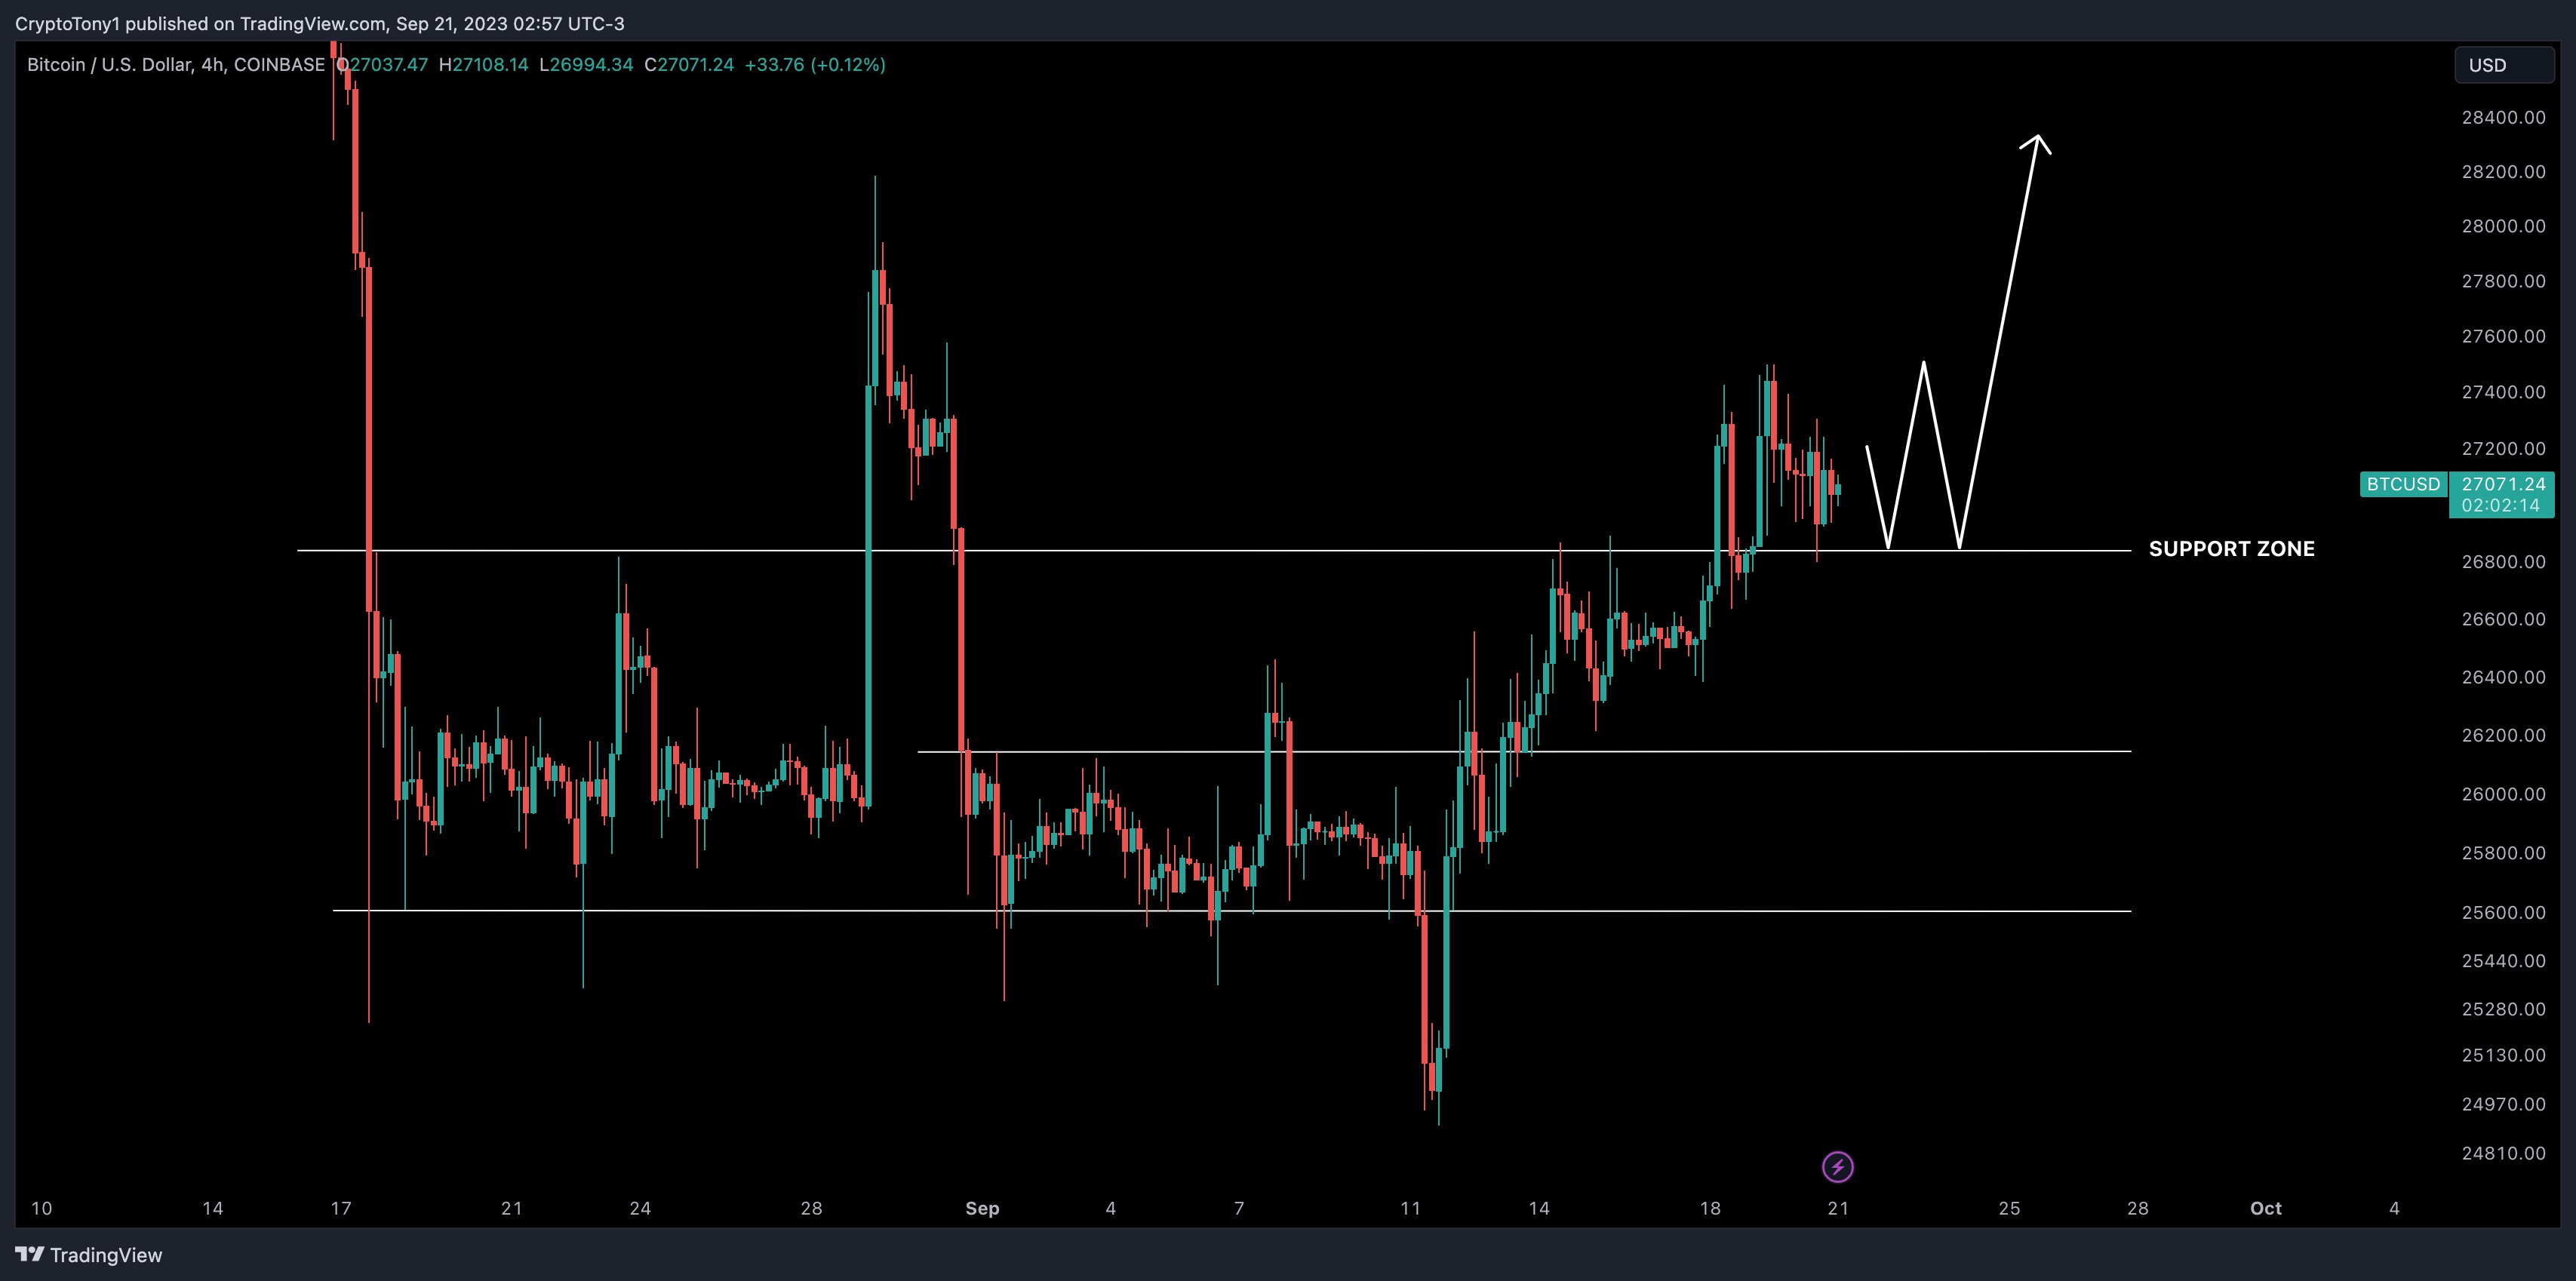
Continuing, fellow trader Crypto Tony reiterated the importance of maintaining $26,800 into the weekly close.
“So my plan was to long while we remained above $26,800 and thus far that is what we are doing,” he commented on the day.
“Certainly came down a bit so up to the bulls now to end this week on a bullish high.”
BTC monthly close focus sharpens
Covering the impetus for the post-Fed drop, trader Crypto Ed suggested that the prior tap of month-to-date highs could be cause for suspicion.
Related: Bitcoin all-time high in 2025? BTC price idea reveals ‘bull run launch’
#BTC
In my recent updates, I shared my feeling that “something” was off with that recent rise to $27,5kSpot (white) offloading here is maybe a warning…….. pic.twitter.com/oabzVKuOvx
— Ed_NL (@Crypto_Ed_NL) September 21, 2023
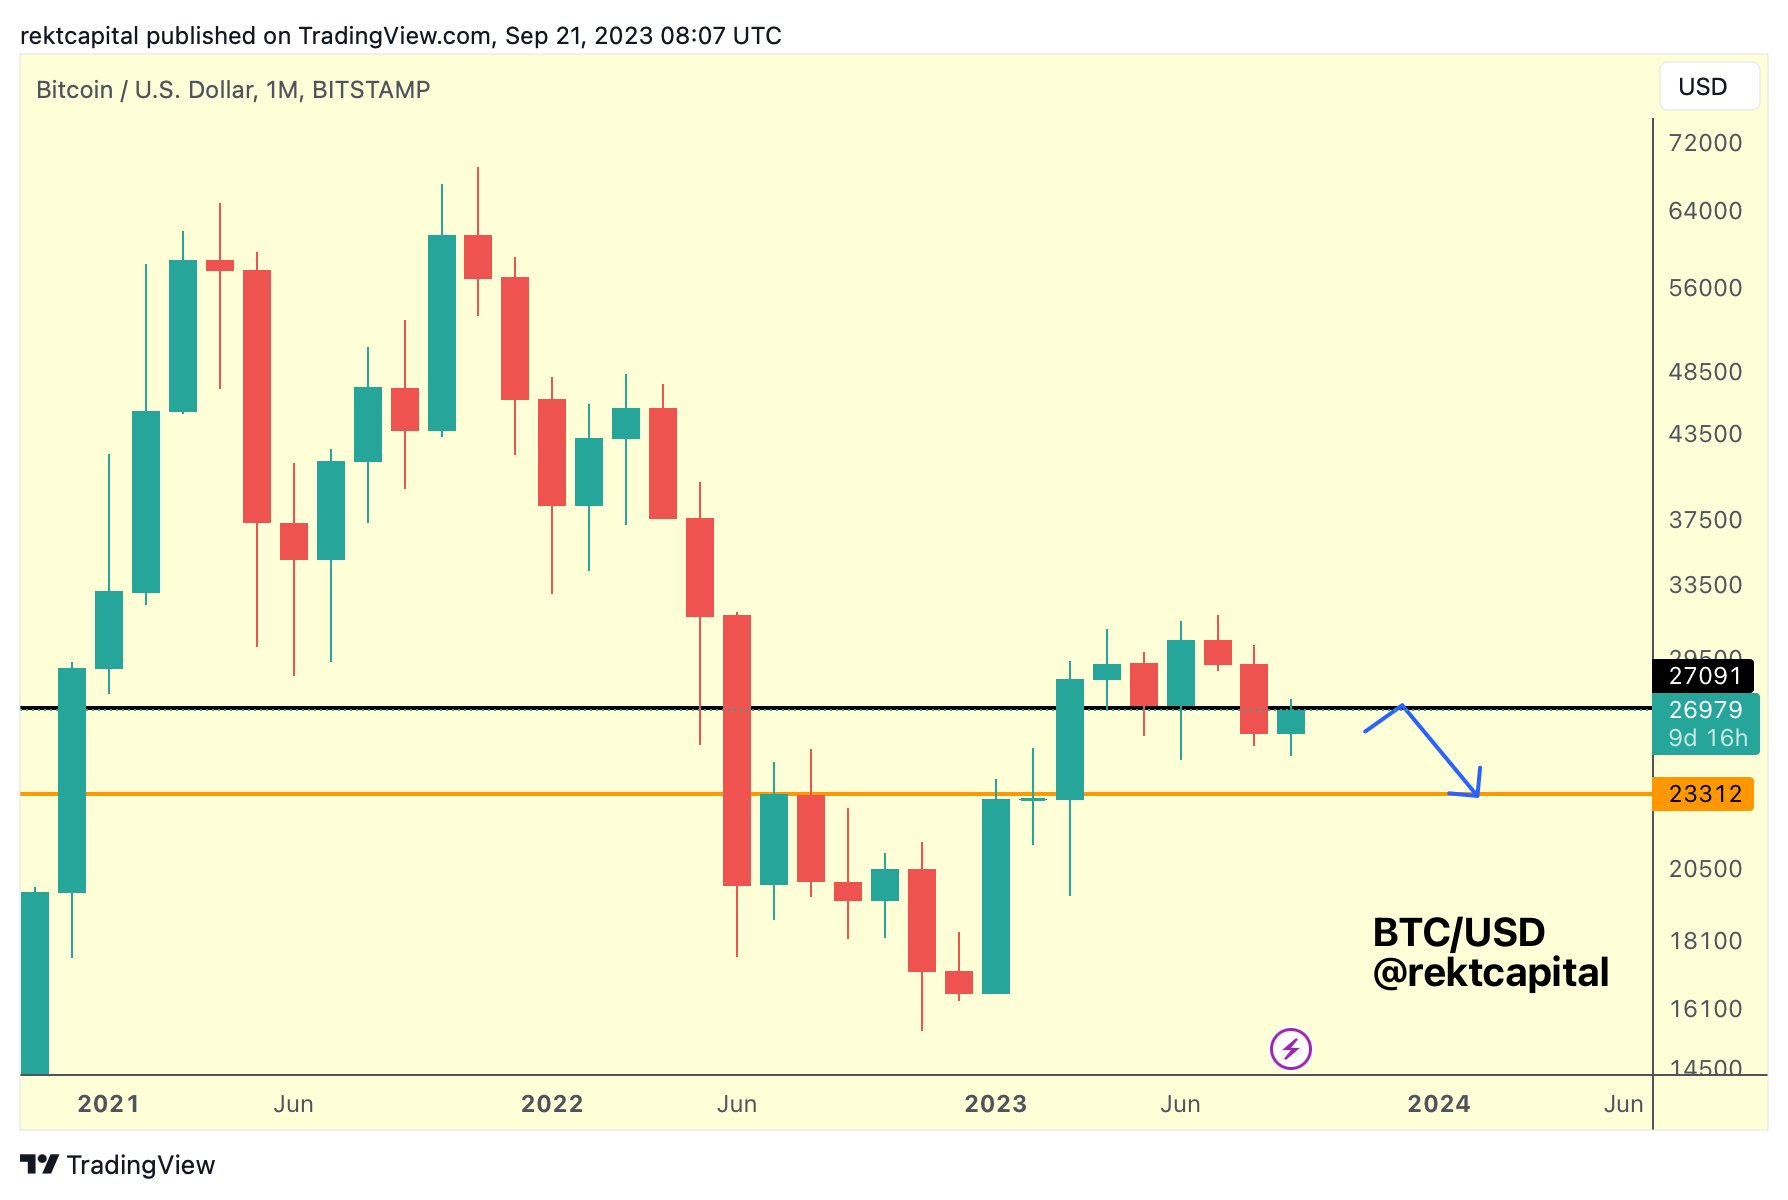
On longer timeframes, trader and analyst was also conservative, preserving his existing theory of BTC price downside to come.
Bitcoin Bearish Fractal Update$BTC #Crypto #Bitcoin https://t.co/4H3OMiDzFB pic.twitter.com/Gn3iH75DFw
— Rekt Capital (@rektcapital) September 21, 2023
On the monthly chart, he added, support at $27,150 had flipped to resistance.
“The BTC Monthly level of ~27150 was lost as support last month,” part of his commentary from the past 24 hours read.
“Now $BTC is rejecting from the same level ~$27150 is acting as resistance for the time being.”
This article does not contain investment advice or recommendations. Every investment and trading move involves risk, and readers should conduct their own research when making a decision.


