


Ethereum (ETH/USD) has gone through a corrective period over the last two months. Since posting a 2019 high of $363.30 on June 26th, the cryptocurrency lost more than 50% of its value. The sentiment has become so bearish that some traders are calling for a move below $100.
However, a leading Wyckoff analyst thinks the exact opposite. The technical trader believes that the retracement is over and the cryptocurrency is getting ready to skyrocket.
Analyst: A Strong Wave up ‘About to Commence’ on Ethereum
If you’re a long-term Ethereum investor, we have good news for you.
Todd Butterfield, the owner of the Wyckoff Stock Market Institute, believes that ETH has posted its 2019 low. The leading technical analysis expert exclusively shared his insights with CCN. He said:
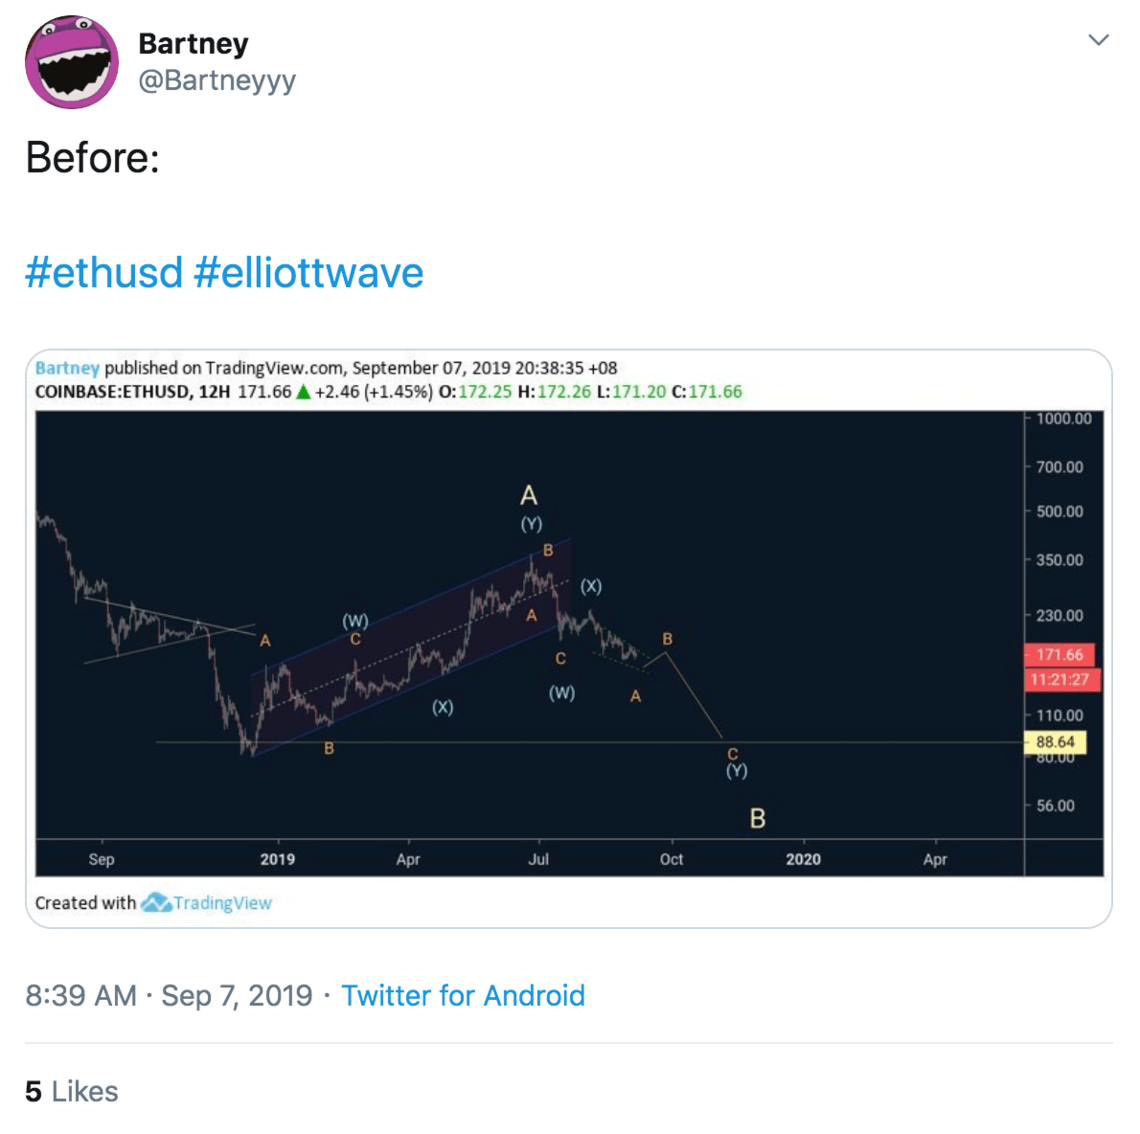
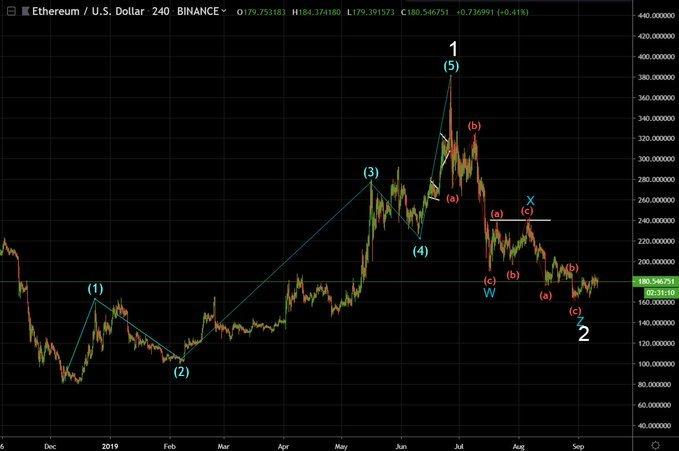
ETH rallied during 2019 in a clear five wave advance, and then proceeded to correct in a WXZ fashion into the recent lows at $163. To Elliott Wave practitioners, this would be an area to enter long positions.
The analyst added:
Off of the recent lows, you can easily see a series of 1-2s. 1-2s could signify a strong wave three about to commence to the upside.
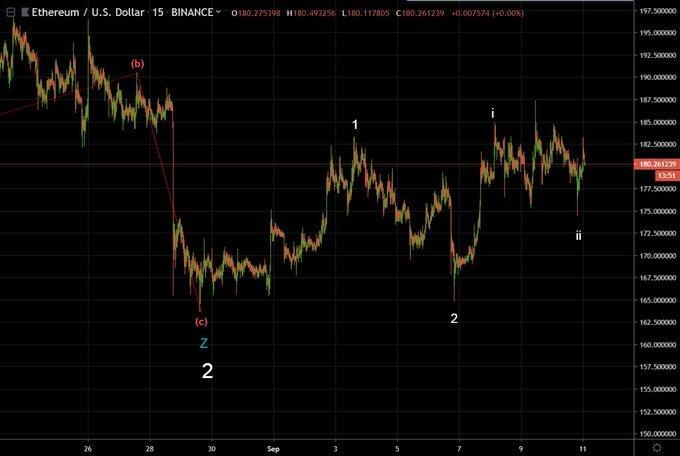
In technical analysis, wave three is the longest wave up. Those who time their entry before wave three erupts are often rewarded with ridiculously handsome profits.
Technical Indicators Validate the Wave Count
Classical charting principles also appear to support Mr. Butterfield’s bullish stance. The Wyckoff expert looked at the volume, price action, and a proprietary indicator called the Technometer. He concluded that the writings on the wall support his Elliot analysis. He said:
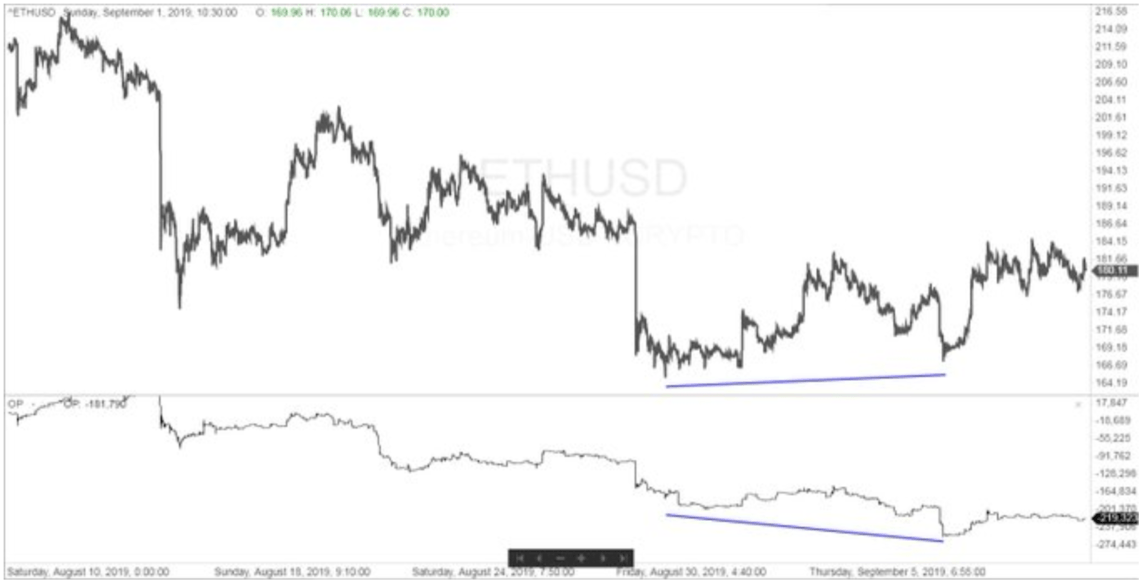
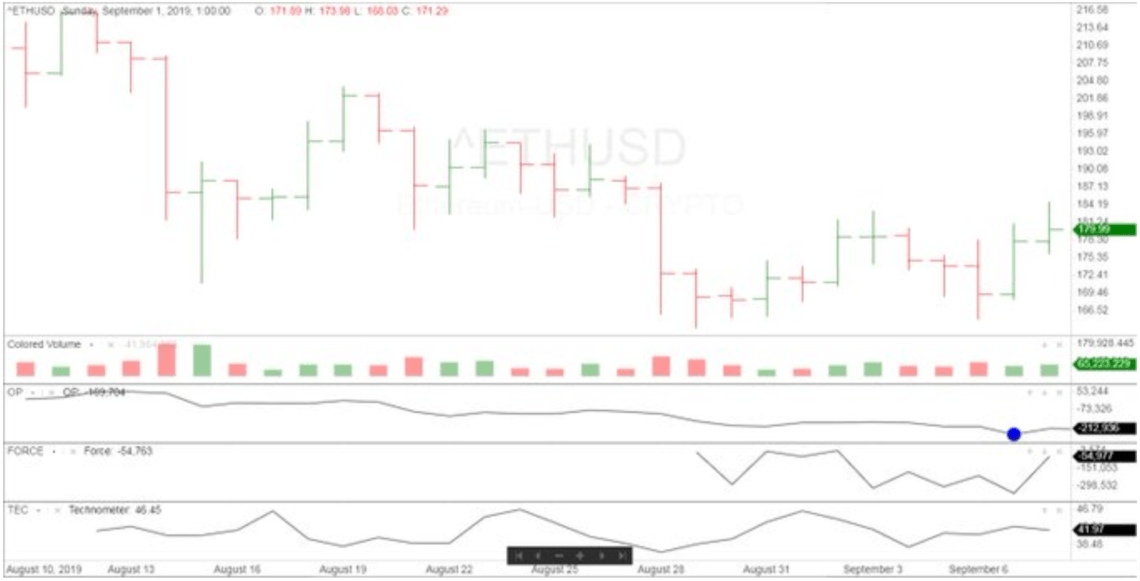
As you can see at the areas marked by the blue lines, OP (volume) went to new lows recently while price held above the lows at $163. This was telling us that selling pressure came into the market but someone was willing to hold the price at higher lows of $167.
In addition, Mr. Butterfield noted:
We have also seen the Technometer registering oversold readings at the recent lows. This is bullish action and also gives us a low risk area to enter long positions. Thus, we are bullish ETH with protective sell stops at $166.
If Mr. Butterfield’s read is correct, then buckle up. The next wave up would leave everyone in a state of massive disbelief.
Last modified (UTC): September 13, 2019 1:08 AM


