

Ripple is facing a couple of hurdles near $0.2220 against the US Dollar. XRP is likely to accelerate higher above $0.2220 unless the bulls lose control and the price drops below $0.2080.
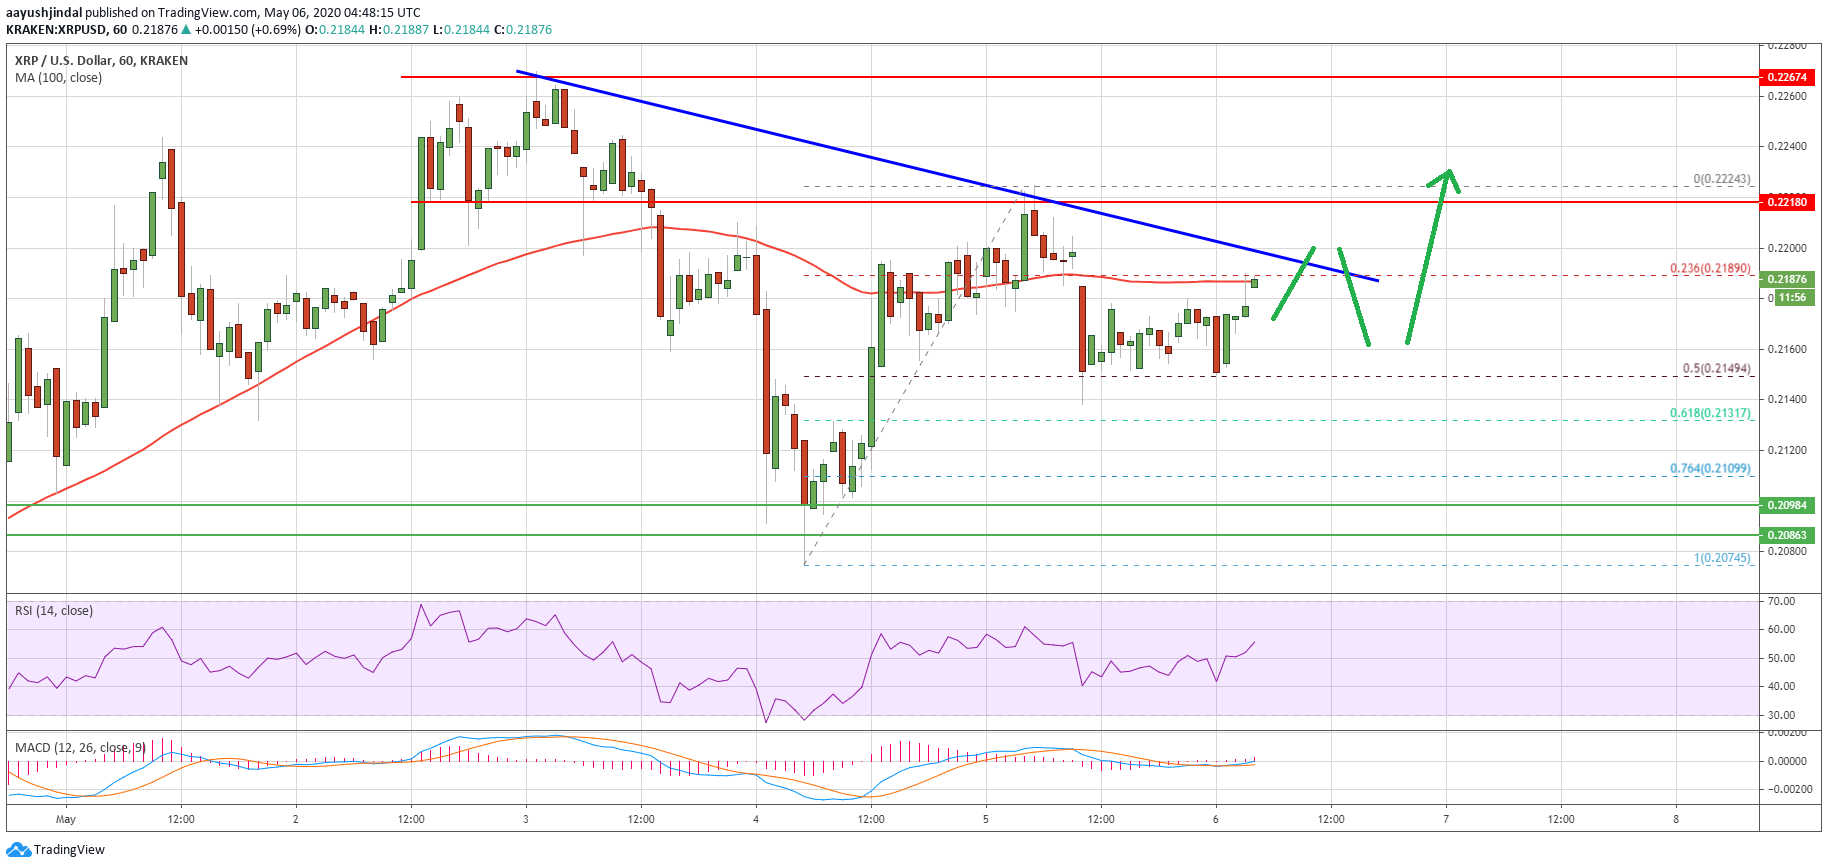
- Ripple price is currently approaching the $0.2200 and $0.2220 resistance levels against the US dollar.
- It seems like a strong support base is forming near the $0.2120 and $0.2080 levels.
- There is a key bearish trend line forming with resistance near $0.2190 on the hourly chart of the XRP/USD pair (data source from Kraken).
- There could be a sustained upward move if the price clears the $0.2220 resistance zone.
Ripple Price Could Continue Higher
Recently, ripple made an attempt to continue higher above the $0.2220 resistance, but it failed. XRP price formed a high near $0.2224 and recently started a downside correction.
There was a break below the $0.2200 support and the 100 hourly simple moving average. It even traded below the 23.6% Fib retracement level of the upward move from the $0.2074 low to $0.2224 high.
On the downside, the $0.2150 support area is acting as a decent buy zone. It is close to the 50% Fib retracement level of the upward move from the $0.2074 low to $0.2224 high.
Ripple is currently rising and approaching the 100 hourly SMA at $0.2190. More importantly, there is a key bearish trend line forming with resistance near $0.2190 on the hourly chart of the XRP/USD pair.
If there is an upside break above $0.2190 and $0.2200, the price could make another attempt to surpass the $0.2220 resistance level. If the bulls gain strength above $0.2220, the price is likely to continue higher towards the $0.2320 and $0.2350 resistance levels in the coming sessions.
Another Rejection?
If ripple fails to continue higher above $0.2200 or $0.2220, it could react to the downside. An initial support on the downside is near the $0.2150 level.
The first major support is near the $0.2100 level, below which the $0.2080 support could act as a strong buy zone. If the bears succeed in clearing the $0.2080 support, there is a risk of a drop towards $0.2000.
Technical Indicators
Hourly MACD – The MACD for XRP/USD is slowly gaining momentum in the bullish zone.
Hourly RSI (Relative Strength Index) – The RSI for XRP/USD is currently well above the 50 level.
Major Support Levels – $0.2150, $0.2100 and $0.2080.
Major Resistance Levels – $0.2200, $0.2220 and $0.2350.
Take advantage of the trading opportunities with Plus500
Risk disclaimer: 76.4% of retail CFD accounts lose money.


