

- Ripple price started a downside correction after rallying towards the $0.2850 resistance against the US dollar.
- The price is currently holding the key $0.2720 and $0.2700 support levels.
- There is a short term breakout pattern forming with resistance near $0.2800 on the hourly chart of the XRP/USD pair (data source from Kraken).
- The price might decline towards the $0.2700 support area before it could climb higher.
Ripple price is currently correcting gains against the US Dollar and bitcoin. XRP price might test the $0.2700 support or $0.2650 before it could rise again.
Ripple Price Analysis
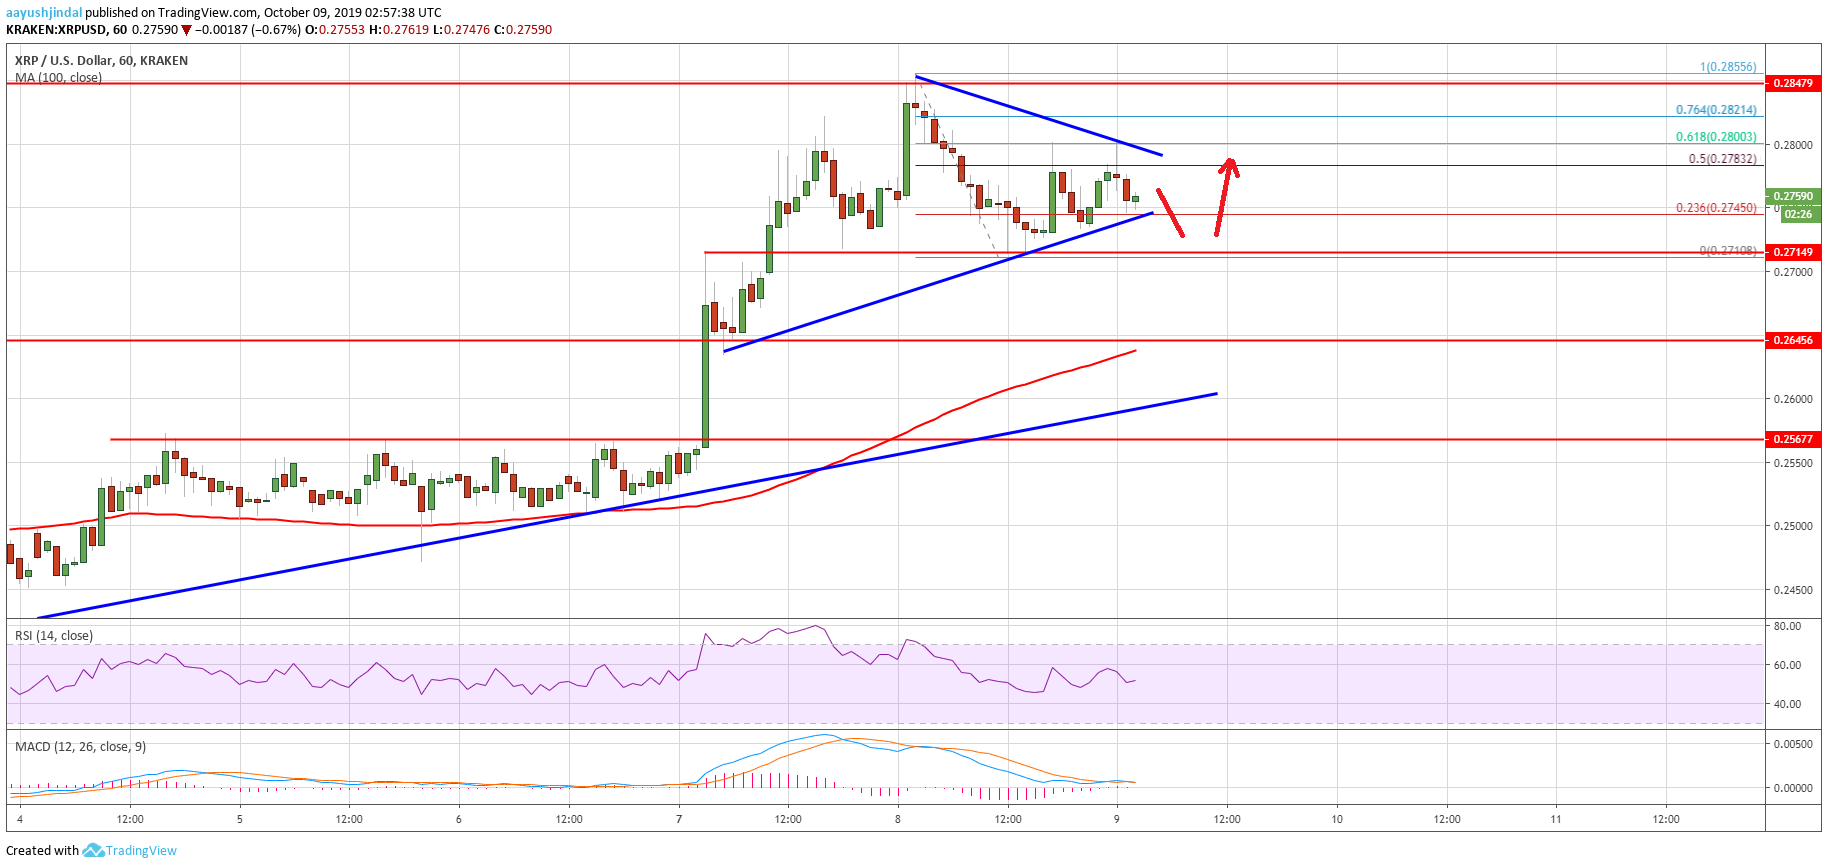
Yesterday, there was a strong upward move in ripple price above the $0.2650 resistance against the US Dollar. XRP price even broke the $0.2720 and $0.2750 resistance levels. Moreover, there was a break above the $0.2800 level and the 100 hourly simple moving average. Finally, the price tested the $0.2850 resistance area, where the bears took a stand. A high was formed at $0.2855 and recently the price started a downside correction.
It broke the $0.2800 and $0.2750 support levels. However, the $0.2720 area acted as a decent support. A low was formed near $0.2710 and the price is currently consolidating. It traded above the 50% Fib retracement level of the recent decline from the $0.2855 high to $0.2710 low. However, it seems like the $0.2800 level is now acting as a solid barrier.
Additionally, the 61.8% Fib retracement level of the recent decline from the $0.2855 high to $0.2710 low also acted as a resistance. At the moment, there is a short term breakout pattern forming with resistance near $0.2800 on the hourly chart of the XRP/USD pair. If there is an upside break above $0.2800, ripple price could climb higher towards the key $0.2850 resistance area.
Any further upsides might start another rise and the price could rally towards the $0.2950 and $0.3000 resistance levels. On the downside, the $0.2720 area is a strong support. If there is a break below $0.2720 and $0.2700, the price could extend its downside correction. The next key support is near the $0.2650 level and the 100 hourly simple moving average.
Looking at the chart, ripple price is correcting gains from the $0.2850 resistance. It seems like it could test $0.2700 or even $0.2650 in the near term. Once the current correction is complete, the price could start a fresh rise towards $0.2800, $0.2850 and $0.2950.
Technical Indicators
Hourly MACD – The MACD for XRP/USD is slowly moving into the bullish zone.
Hourly RSI (Relative Strength Index) – The RSI for XRP/USD is currently just above the 50 level.
Major Support Levels – $0.2720, $0.2700 and $0.2650.
Major Resistance Levels – $0.2800, $0.2850 and $0.2920.

 Bullish Breakout Seems Real: Indicators Suggest Sustained Rally")