

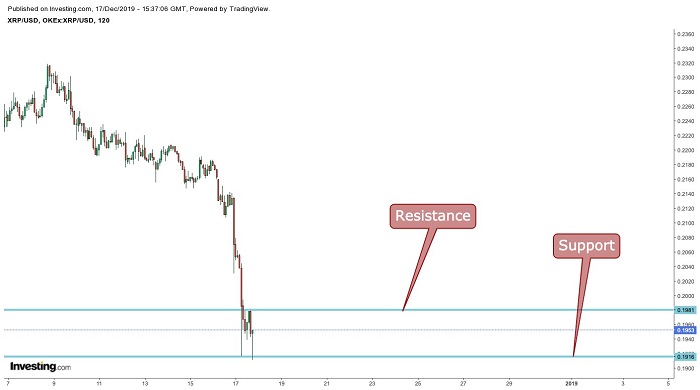
When we observe the chart below we can see that Ripple (XRP)trade is trading at $0.1983. It has recently broken the the support level of $0.2053 and then another support level at $0.1981.
The digital currency is in a clear downtrend and is seen to have found some base at $0.1916, which is also confirmed by the formation of a hammer pattern. The XRP price may fall further so it is suggested to stick to a stoploss around the support.
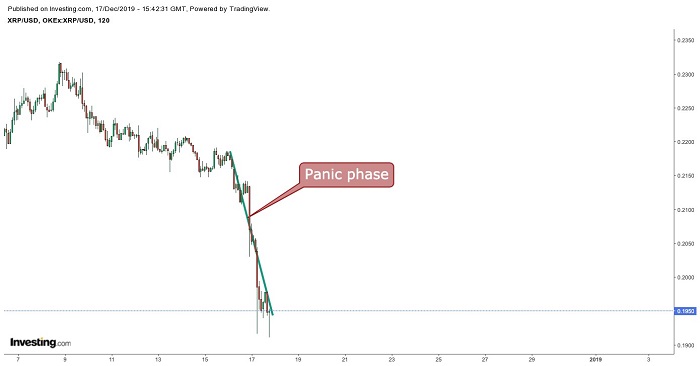
Dow Theory
The XRP price currently appears to be in the panic phase, which is in fact the ensuing part of the distribution phase. During this phase the investors from the accumulation phase start distributing and selling their digital currency which leads to panic in the market, and the result is that the virtual coin is oversold and the accumulation phase begins yet again.
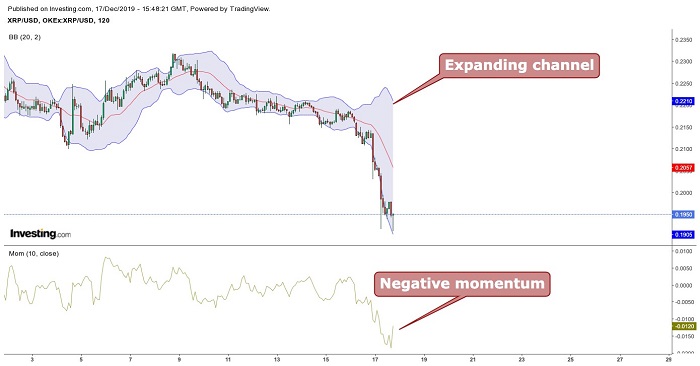
Bollinger Bands
Ripple’s price is moving between the channels with the middle average line acting as resistance and the lower limit line acting as support. It can be seen that the channel is expanding with a negative momentum, which indicates increased volatility with a bearish sentiment.
Therefore, the third-largest cryptocurrency’s price can fall even further, and hence, taking long positions is not suggested as currently the sentiment is bearish.
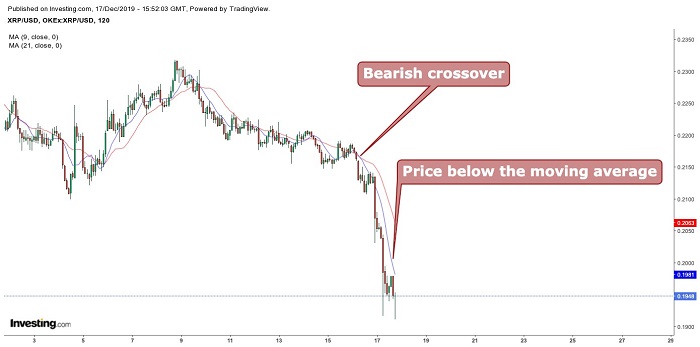
Moving Average
When taking the 9-period moving average (blue) with the 21-period moving average (red), a bearish crossover is noted with the XRP price trading below the 9 and 21 period moving averages. This indicates a clear downtrend, and therefore it is suggested to wait until the digital currency’s price starts trading above the moving average before taking any long position.
Conclusion
Ripple (XRP)trade is currently trading at $0.1983. The support level is at $0.1916 and the resistance level at $0.1981. It is suggested not to take long positions at this price range as all the indicators are negative with no sign of upward movement.
The price of the cryptocurrency may go down even further. If a long position is taken then a stop loss command should be placed around the support level. The 9-period moving average is also acting as resistance and can be used as another indicator.
The current trend is cearly bearish with no signs of improvement. Risk avioders should buy into a position only after the XRP price closes above $0.1981.
Pivot Points
| Name | S3 | S2 | S1 | Pivot Points | R1 | R2 | R3 |
| Classic | 0.1929 | 0.2038 | 0.2100 | 0.2209 | 0.2271 | 0.2380 | 0.2442 |
| Fibonacci | 0.2038 | 0.2103 | 0.2144 | 0.2209 | 0.2274 | 0.2315 | 0.2380 |
| Camarilla | 0.2114 | 0.2130 | 0.2145 | 0.2209 | 0.2177 | 0.2192 | 0.2208 |
| Woodie’s | 0.1905 | 0.2026 | 0.2076 | 0.2197 | 0.2247 | 0.2368 | 0.2418 |
Technical Indicators
| Name | Value | Action |
| RSI(14) | 31.486 | Sell |
| STOCH(9,6) | 27.898 | Sell |
| STOCHRSI(14) | 0.000 | Oversold |
| MACD(12,26) | -0.026 | Sell |
| ADX(14) | 31.769 | Sell |
| Williams %R | -97.628 | Oversold |
| CCI(14) | -143.3519 | Sell |
| ATR(14) | 0.0387 | Less Volatility |
| Highs/Lows(14) | -0.0431 | Sell |
| Ultimate Oscillator | 40.295 | Sell |
| ROC | -25.613 | Sell |
| Bull/Bear Power(13) | -0.0858 | Sell |

