Altcoins have been inching their way deeper into my trading routine and this seventh entry of the crypto trading journal features a newly opened position on VeChain (VET), as well as a timely buy of Stellar Lumens (XLM). I am still long on Bitcoin (BTC) from under $9,000, as price moves sideways.
XLM/BTC
Part 1: Setting up the trade
Entries: .00000800 satoshis (sats), .00000870(sats), .00000797 (sats)
Targets: 0.00000940 (sats), .00001044 (sats)
Stop loss: The first stop loss was set at .00000781 (sats) on the breakout. As usual, I move this up to follow the price when required.
Risk / reward: Target 1 = 7.37, Target 2 = 12.84
Entry Idea
A member of the TexasWest Capital Discord asked me to chart XLM a few days before, and I identified the .00000797 (sats) area as a place that I would consider buying. In a surprise announcement, the Stellar Lumens team decided to burn 50% of the coin supply, causing a large and fast upside move, which caused my alarms at .00000797 (sats) to go off.
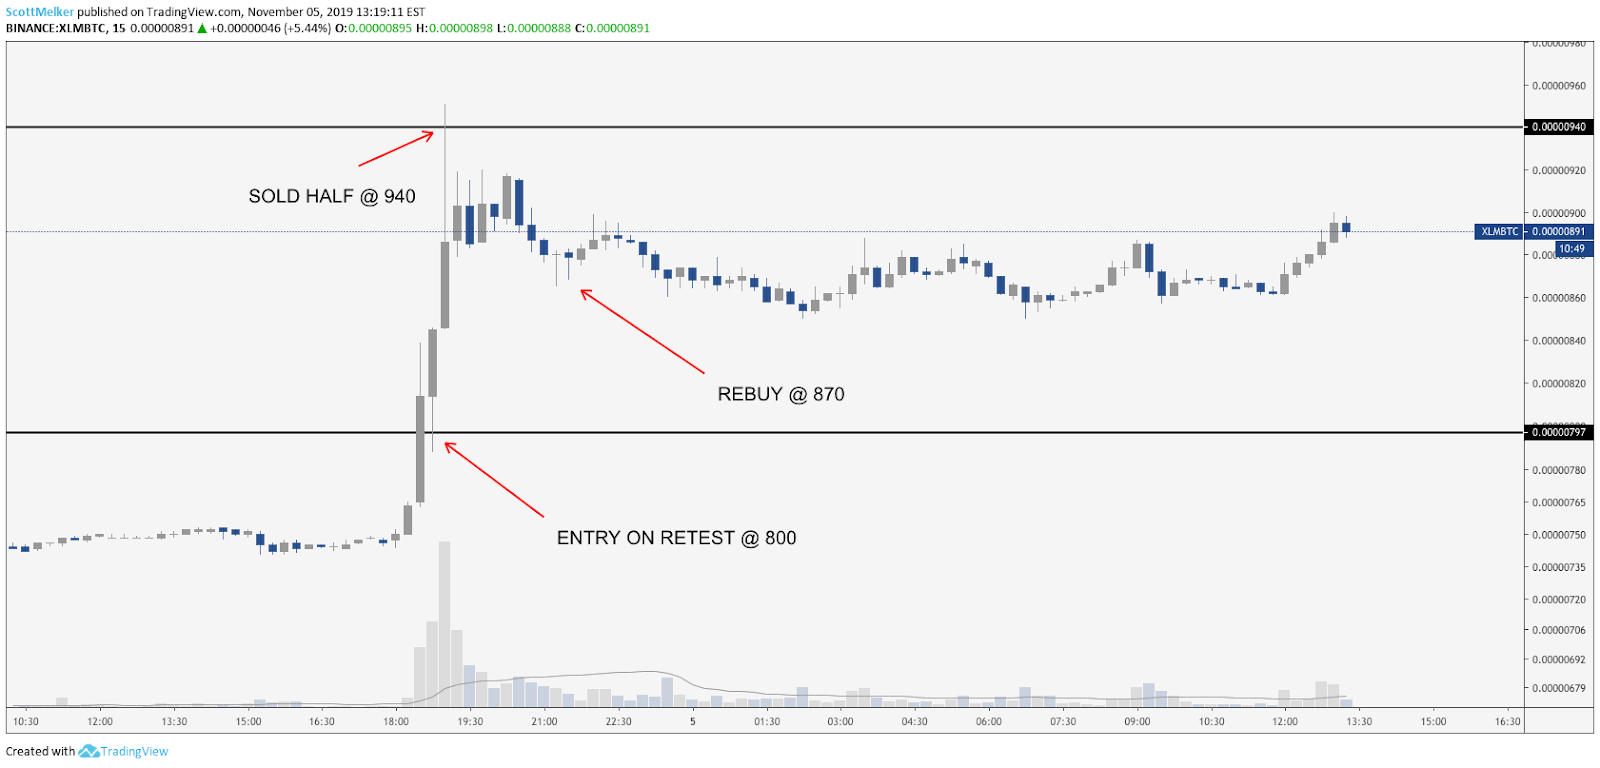
My preferred strategy is to buy the retest of a key resistance as support rather than just buying the breakout. As can be seen in the second chart below, XLM price came back and tested support, which is where I entered.
I set my buy orders at .00000800 (sats) instead of .00000797 (sats), just in case that line was front-run. This is a 15-minute chart, a time frame I rarely utilize. However, in a move this large and fast based on news, the price was unlikely to retest over a longer period of time, so I was willing to trade this smaller time frame.
I rarely FOMO into positions, but I saw the 50% burn as a legitimate catalyst and expected the price to potentially pull off an absolutely massive pump. When the fundamentals line up with the chart, you generally have to move very quickly to catch it.
XLM BTC daily chart. Source: TradingView
XLM BTC 15 minute chart. Source: TradingView
I immediately set my take profit for half of my position at .00000940 (sats), an area I saw as a key resistance. Within an hour, the price hit this line and dropped, which was ultimately the top of the move. In an effort to catch a second pump, I reentered at .00000870 (sats) but ultimately stopped out of this trade with the entire position at that same line when the price dropped.
How it worked out
I made 17.5% on half of this position in less than an hour, a very successful trade in my mind. The remainder closed at .00000870 (sats) for a profit of 8.75%
Part 2: Setting up another XLM trade
Entry: .00000797(sats)
Targets: 0.00000940 (sats), .00001044 (sats)
Stop loss: .00000781(sats) on the breakout.
Risk / reward: Target 1 = 8.94, Target 2 = 15.5
Entry Idea
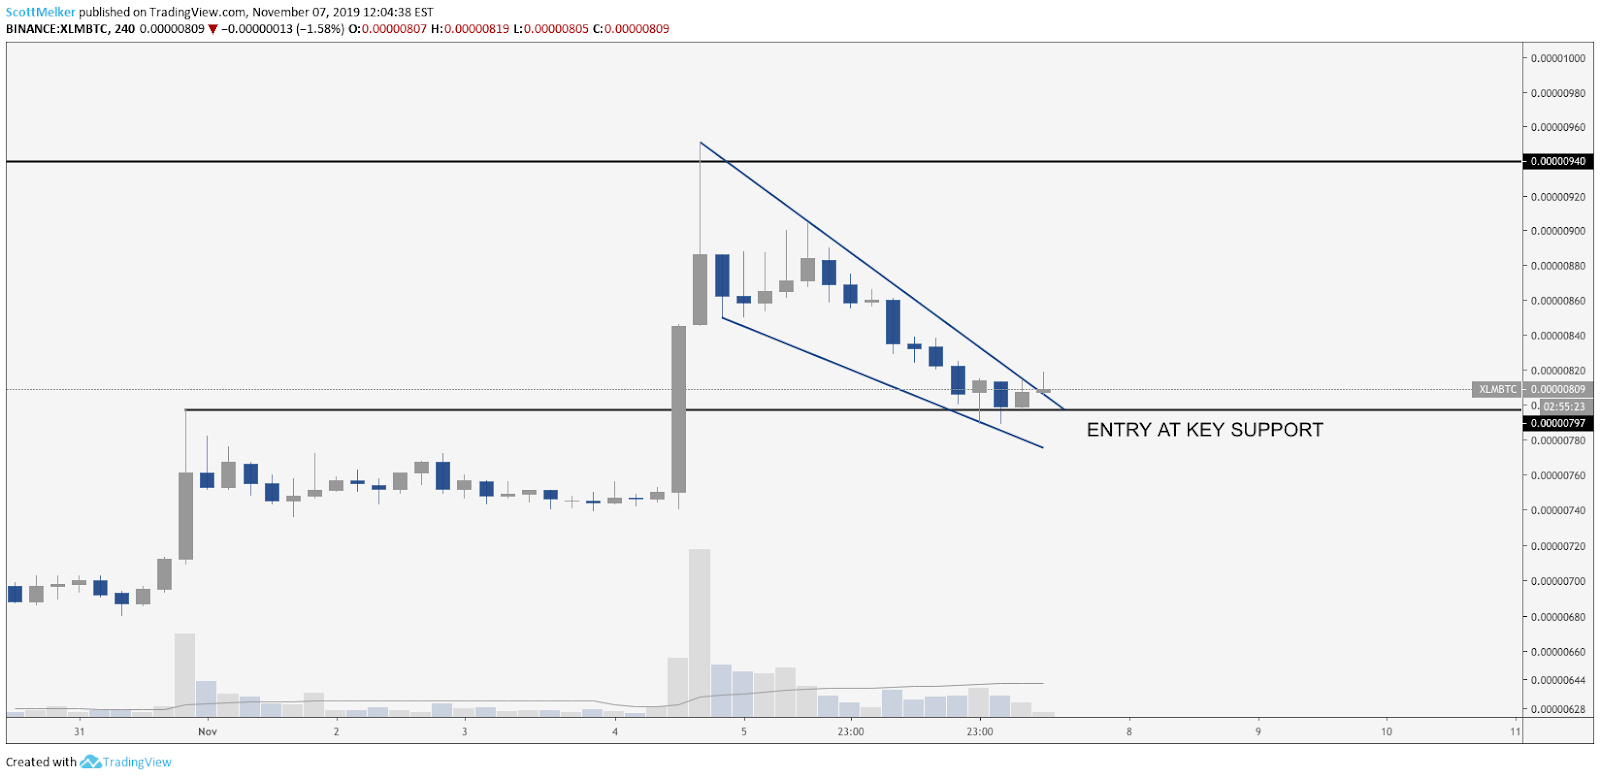
This is effectively a second round of the same trade, with the first retest of the .00000797 (sats) line on a larger time frame. The FOMO has passed, so this key support is a likely place for a bounce if the price is going to continue up longer term. I will continue to update this trade in future journals.
XLM BTC 4-hour chart. Source: TradingView
VET/BTC
Entry: .00000050 (sats)
Targets: 0.00000062 (sats), .00000080 (sats), .000000102 (sats)
Stop loss: .00000781 (sats) on the breakout.
Risk / reward: Target 1 = 8.94, Target 2 = 15.5
Entry Idea
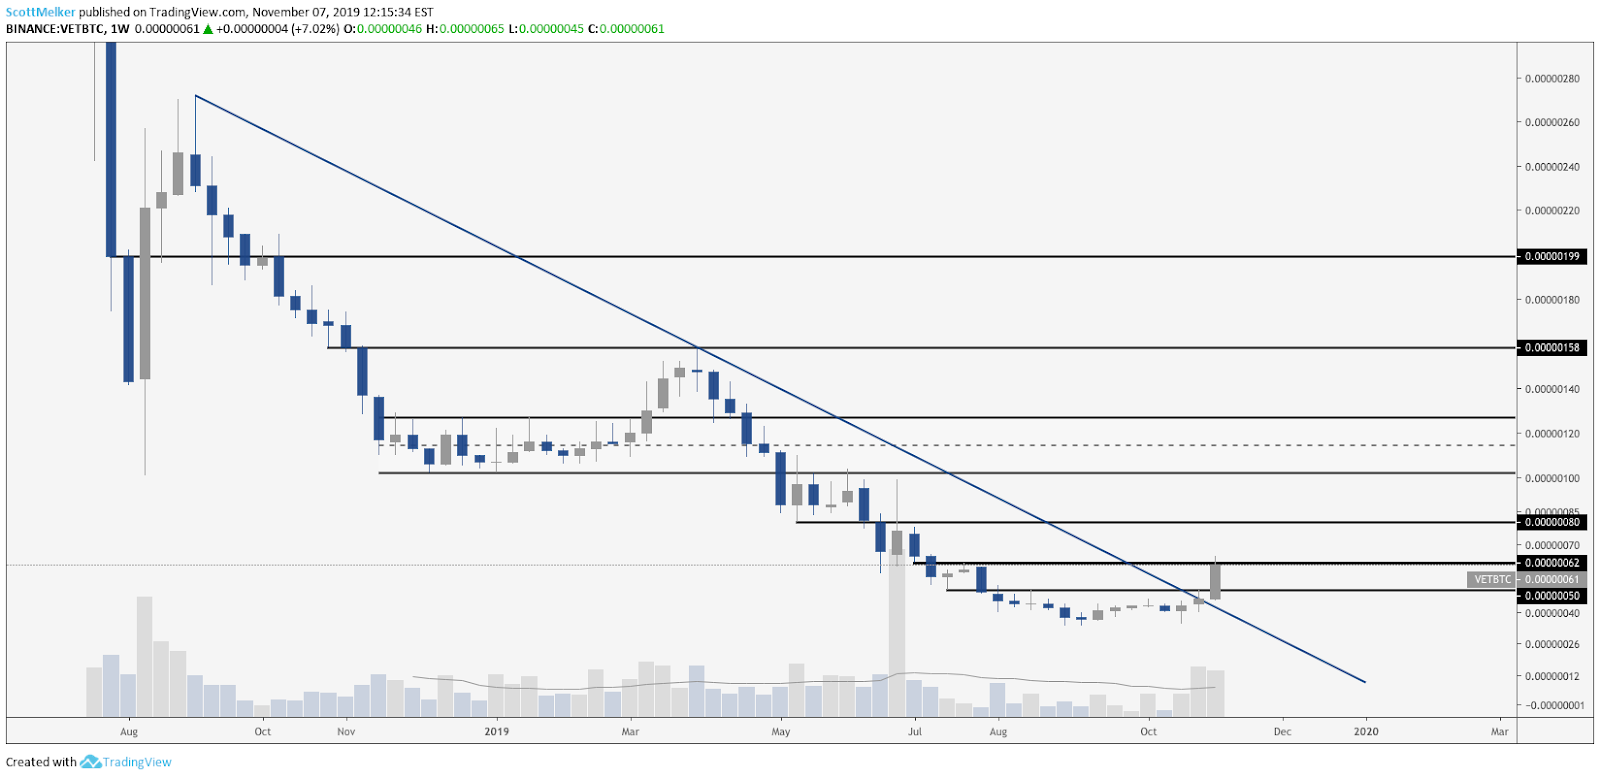
VET has historically been one of my favorite assets to trade, so I have been watching it for months. I identified .00000050 (sats) as the key area that, if broken, would signal that price was likely to continue up. Other areas of likely resistance (targets) are shown on the weekly chart below. I also drew a descending resistance, which price broke clearly on the weekly chart.
VET BTC weekly chart. Source: TradingView
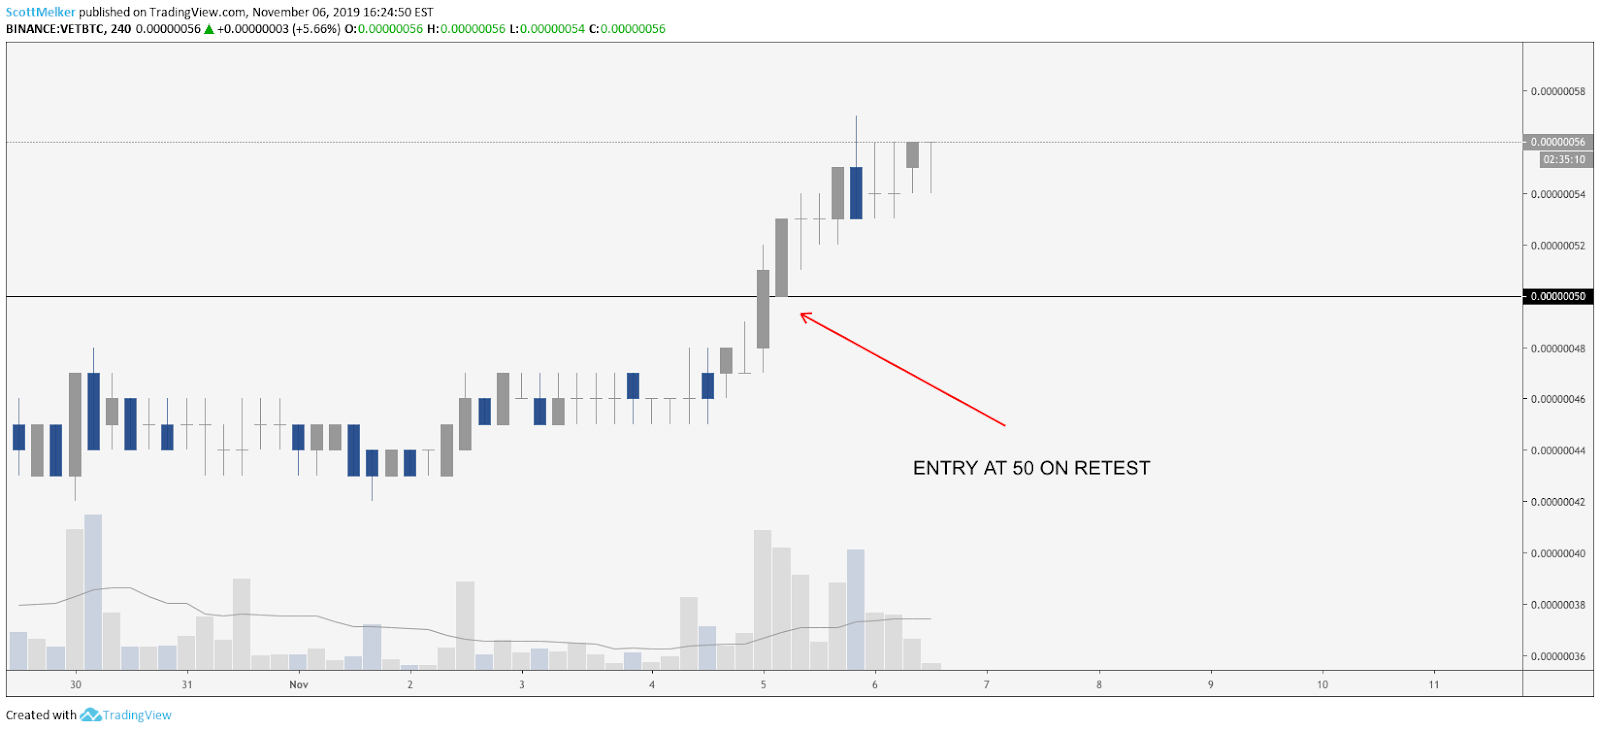
Like the XLM trade above, I waited for a retest of resistance as support to enter. I entered at .00000050 (sats) based on this retest on the 4-hour chart.
VET BTC 4-hour chart. Source: TradingView
How it worked out
I have already taken profit on half of the position at .00000062 (sats), my first target, a 24% gain. The rest of the position remains open, waiting for a chance to hit higher targets. I will keep this trade open for as long as Bitcoin remains stable.
BTC/USD update
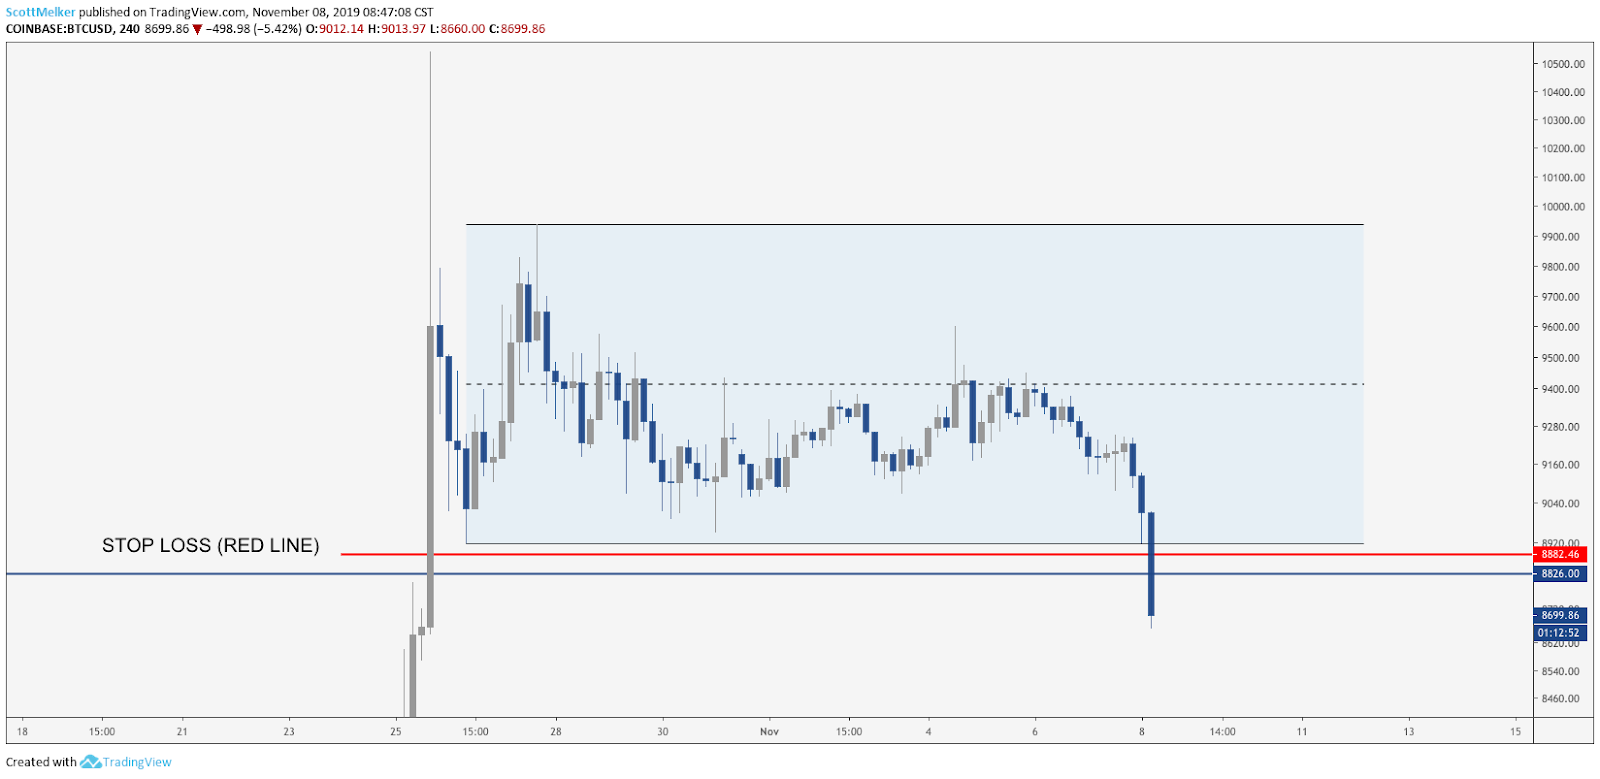
I stopped out of my two-week-long Bitcoin trade at a small loss this morning when the range lows were broken. I had plenty of opportunities to take some profit, so this was a poorly managed trade in my mind. In retrospect, I should have exited when the price was clearly rejected at the equilibrium of the trading range (dashed line). The details of the trade were described in the previous analysis. This amounted to a 1.2% loss on the position and a negligible portfolio loss.
BTC USD 4-hour chart. Source: TradingView
Additional trades:
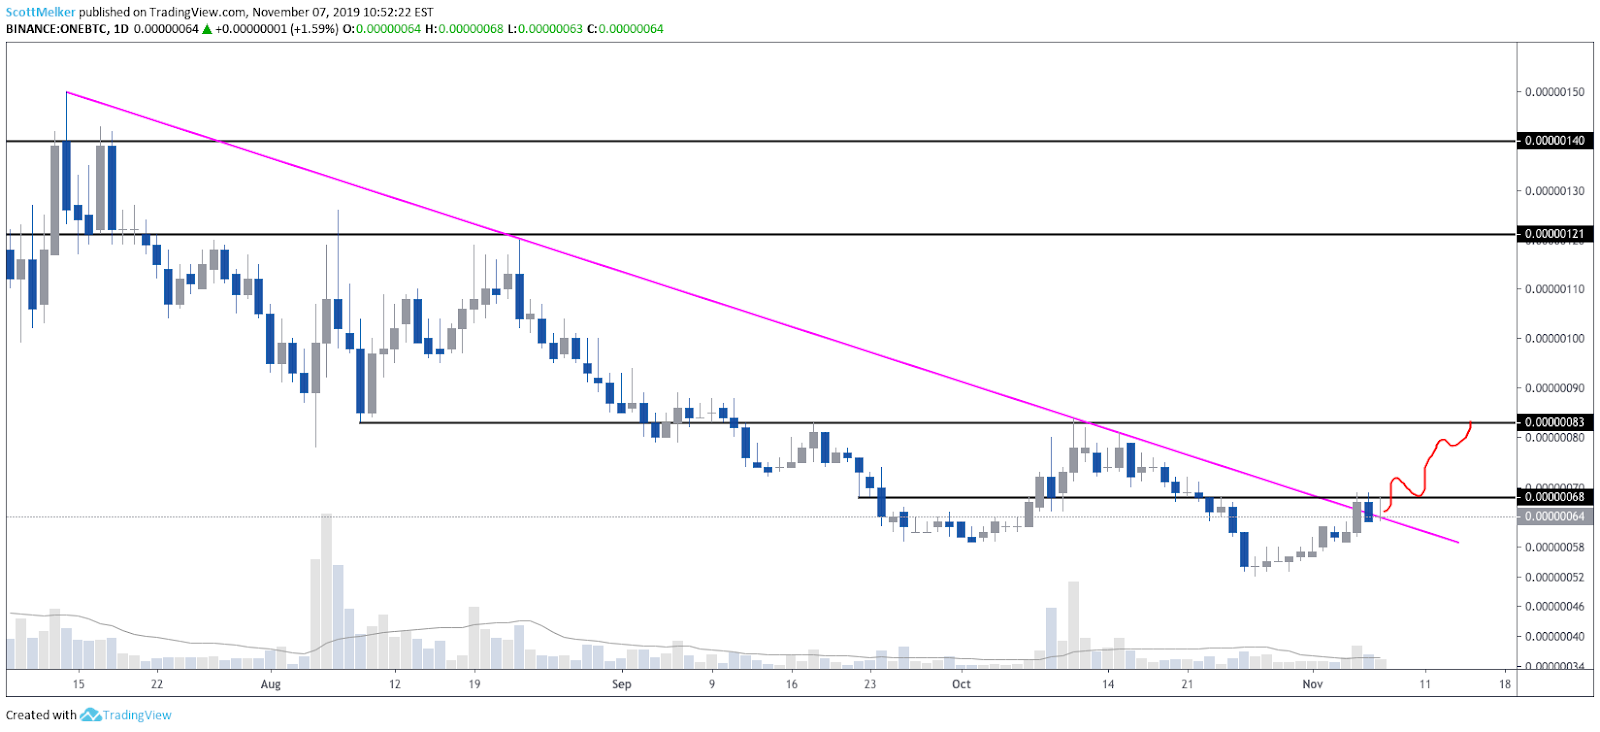
ONE BTC daily chart. Source: TradingView
I have also entered a position on Harmony (ONE), with the basic setup shown below. I will update this in the next journal. I also still hold positions in Dogecoin (DOGE) and Holo (HOT), which I will update when the price action details such an update as relevant.
The views and opinions expressed here are solely those of the (@scottmelker) and do not necessarily reflect the views of CryptoX. Every investment and trading move involves risk. You should conduct your own research when making a decision.


