
Analysis
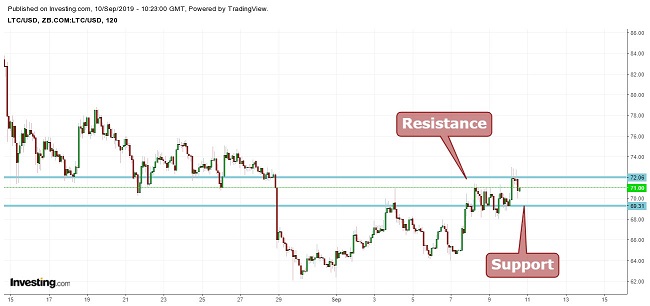
Litecoin (LTC)trade is currently trading at $71.12. The digital coin is facing resistance at $72.09 and support at $69. LTC price is expected is to trade between the channel and long position should not be taken at this price.
It is suggested to wait until the price reaches the support, or breaks the resistance.
Dow Theory
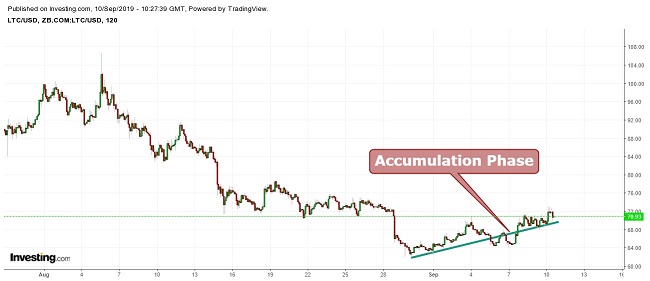
The accumulation phase usually starts when informed investors (experienced traders and institutions) are beginning to enter their positions. The price movements during the accumulation phase are slow.

The accumulation phase often falls into the end of a downtrend where ordinary investors believe that more bearishness is likely and the overall outlook is pessimistic. It is followed by the participation phase.
Moving Average
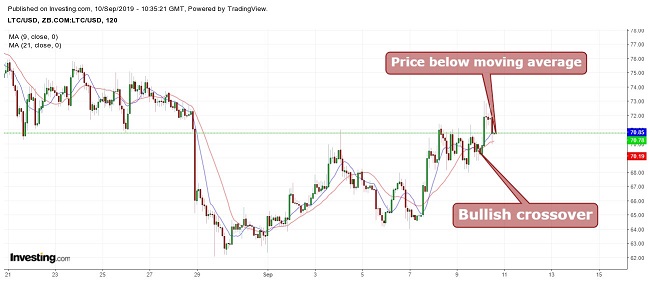
When taking 9 period moving averages (blue) with 21 period moving averages (red), there is a bullish crossover. Yet, the Litecoin price is below the 9 period moving averages, which indicates a correction. It is suggested to wait until the price closes above the 9 period moving average.
Bollinger Bands
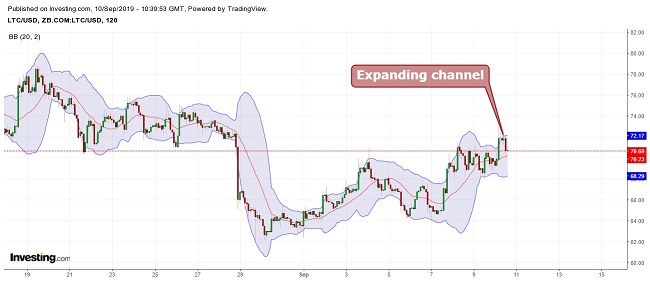
The price is moving between the channels, with the upper limit acting as resistance and the middle average line acting as support. The expanding channel indicates increased volatility.
Conclusion
Litecoin (LTC)trade is presently trading at $71.12. The first resistance level is at $72.09 and the first support level is at $69. It is recommended not to take long positions at this current price, and wait for the cryptocurrency to touch the first support level.
If the digital currency price closes a trading day above $71, it can then reach $75.5. A close below $69 can drag the price below all the down to $65. Swing trading can be done using the above mentioned levels. The mid-term trend is bullish.
Pivot Points
| Name | S3 | S2 | S1 | Pivot Points |
R1 | R2 | R3 |
| Classic | 57.557 | 60.695 | 64.691 | 67.829 | 71.825 | 74.963 | 78.959 |
| Fibonacci | 60.695 | 63.420 | 65.104 | 67.829 | 70.554 | 72.238 | 74.963 |
| Camarilla | 66.724 | 67.378 | 68.032 | 67.829 | 69.340 | 69.994 | 70.648 |
| Woodie’s | 57.985 | 60.909 | 65.119 | 68.043 | 72.253 | 75.177 | 79.387 |
Technical Indicators
| Name | Value | Action |
| RSI(14) | 43.323 | Sell |
| STOCH(9,6) | 14.631 | Oversold |
| STOCHRSI(14) | 9.393 | Oversold |
| MACD(12,26) | -0.997 | Sell |
| ADX(14) | 38.250 | Neutral |
| Williams %R | -89.407 | Oversold |
| CCI(14) | -91.3924 | Sell |
| ATR(14) | 19.3742 | Less Volatility |
| Highs/Lows(14) | -16.6186 | Sell |
| Ultimate Oscillator | 37.601 | Sell |
| ROC | -39.871 | Sell |
| Bull/Bear Power(13) | -24.6180 | Sell |