

XRP (XRP) has dropped nearly 30% since hitting a seven-year high of $3.39 in January.
Still, bullish news—like Ripple’s potential resolution in the SEC lawsuit and a new license in Dubai—has fueled a rebound. As of March 24, XRP was trading for as high as $2.47, up 38% from its year-to-date low of $1.79.
XRP/USD daily price chart. Source: TradingView
How high can the XRP price go from here? Let’s examine.
XRP parallel channel projects $2.77 target
XRP is climbing within a rising parallel channel, showing signs of strength as it pushes toward a crucial resistance level.
Key takeawas:
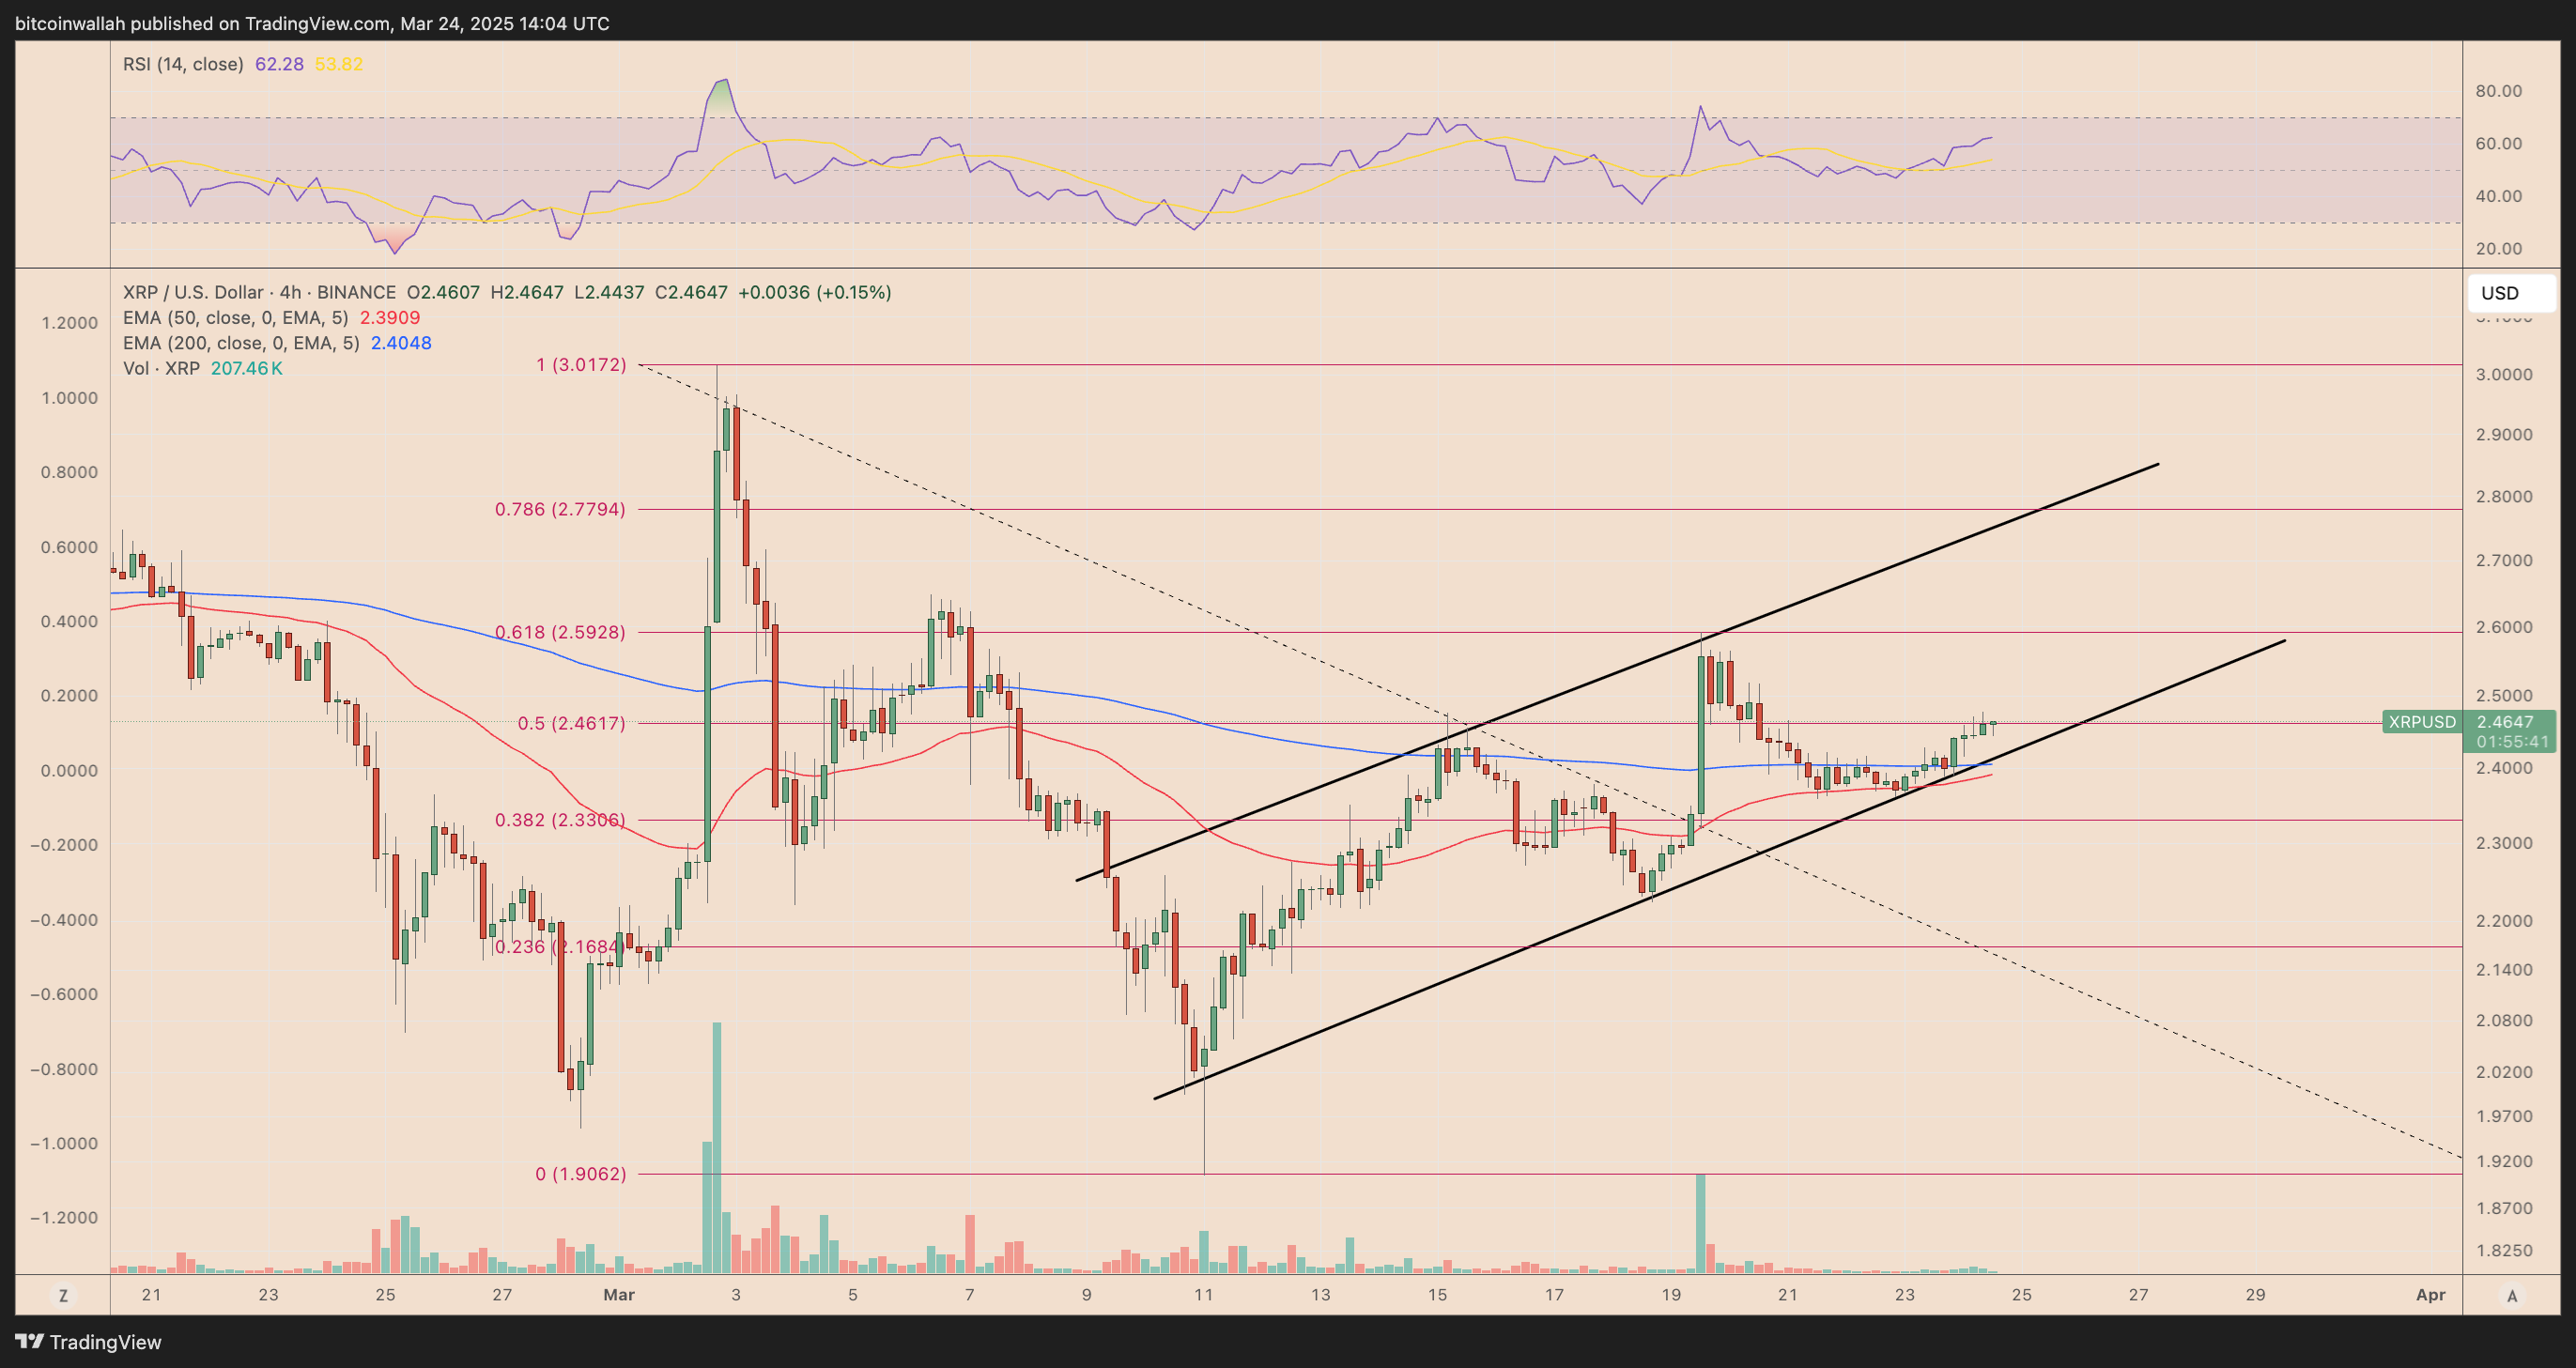
XRP/USD four-hour price chart. Source: TradingView
-
The pair is now eyeing a retest of $2.59—the 0.618 Fibonacci retracement level—which previously acted as a strong resistance capping the March 19 rally.
-
A successful breakout above this resistance could see XRP testing the channel’s upper trendline, located near $2.77—coinciding with the 0.786 Fibonacci level.
Related: XRP, Solana lead altcoin ETP inflows as Ethereum slumps — CoinShares
-
Market analyst Dom emphasized that XRP must stabilize above $2.50, which aligns with its all-time high volume-weighted average price (VWAP), to sustain bullish continuation.
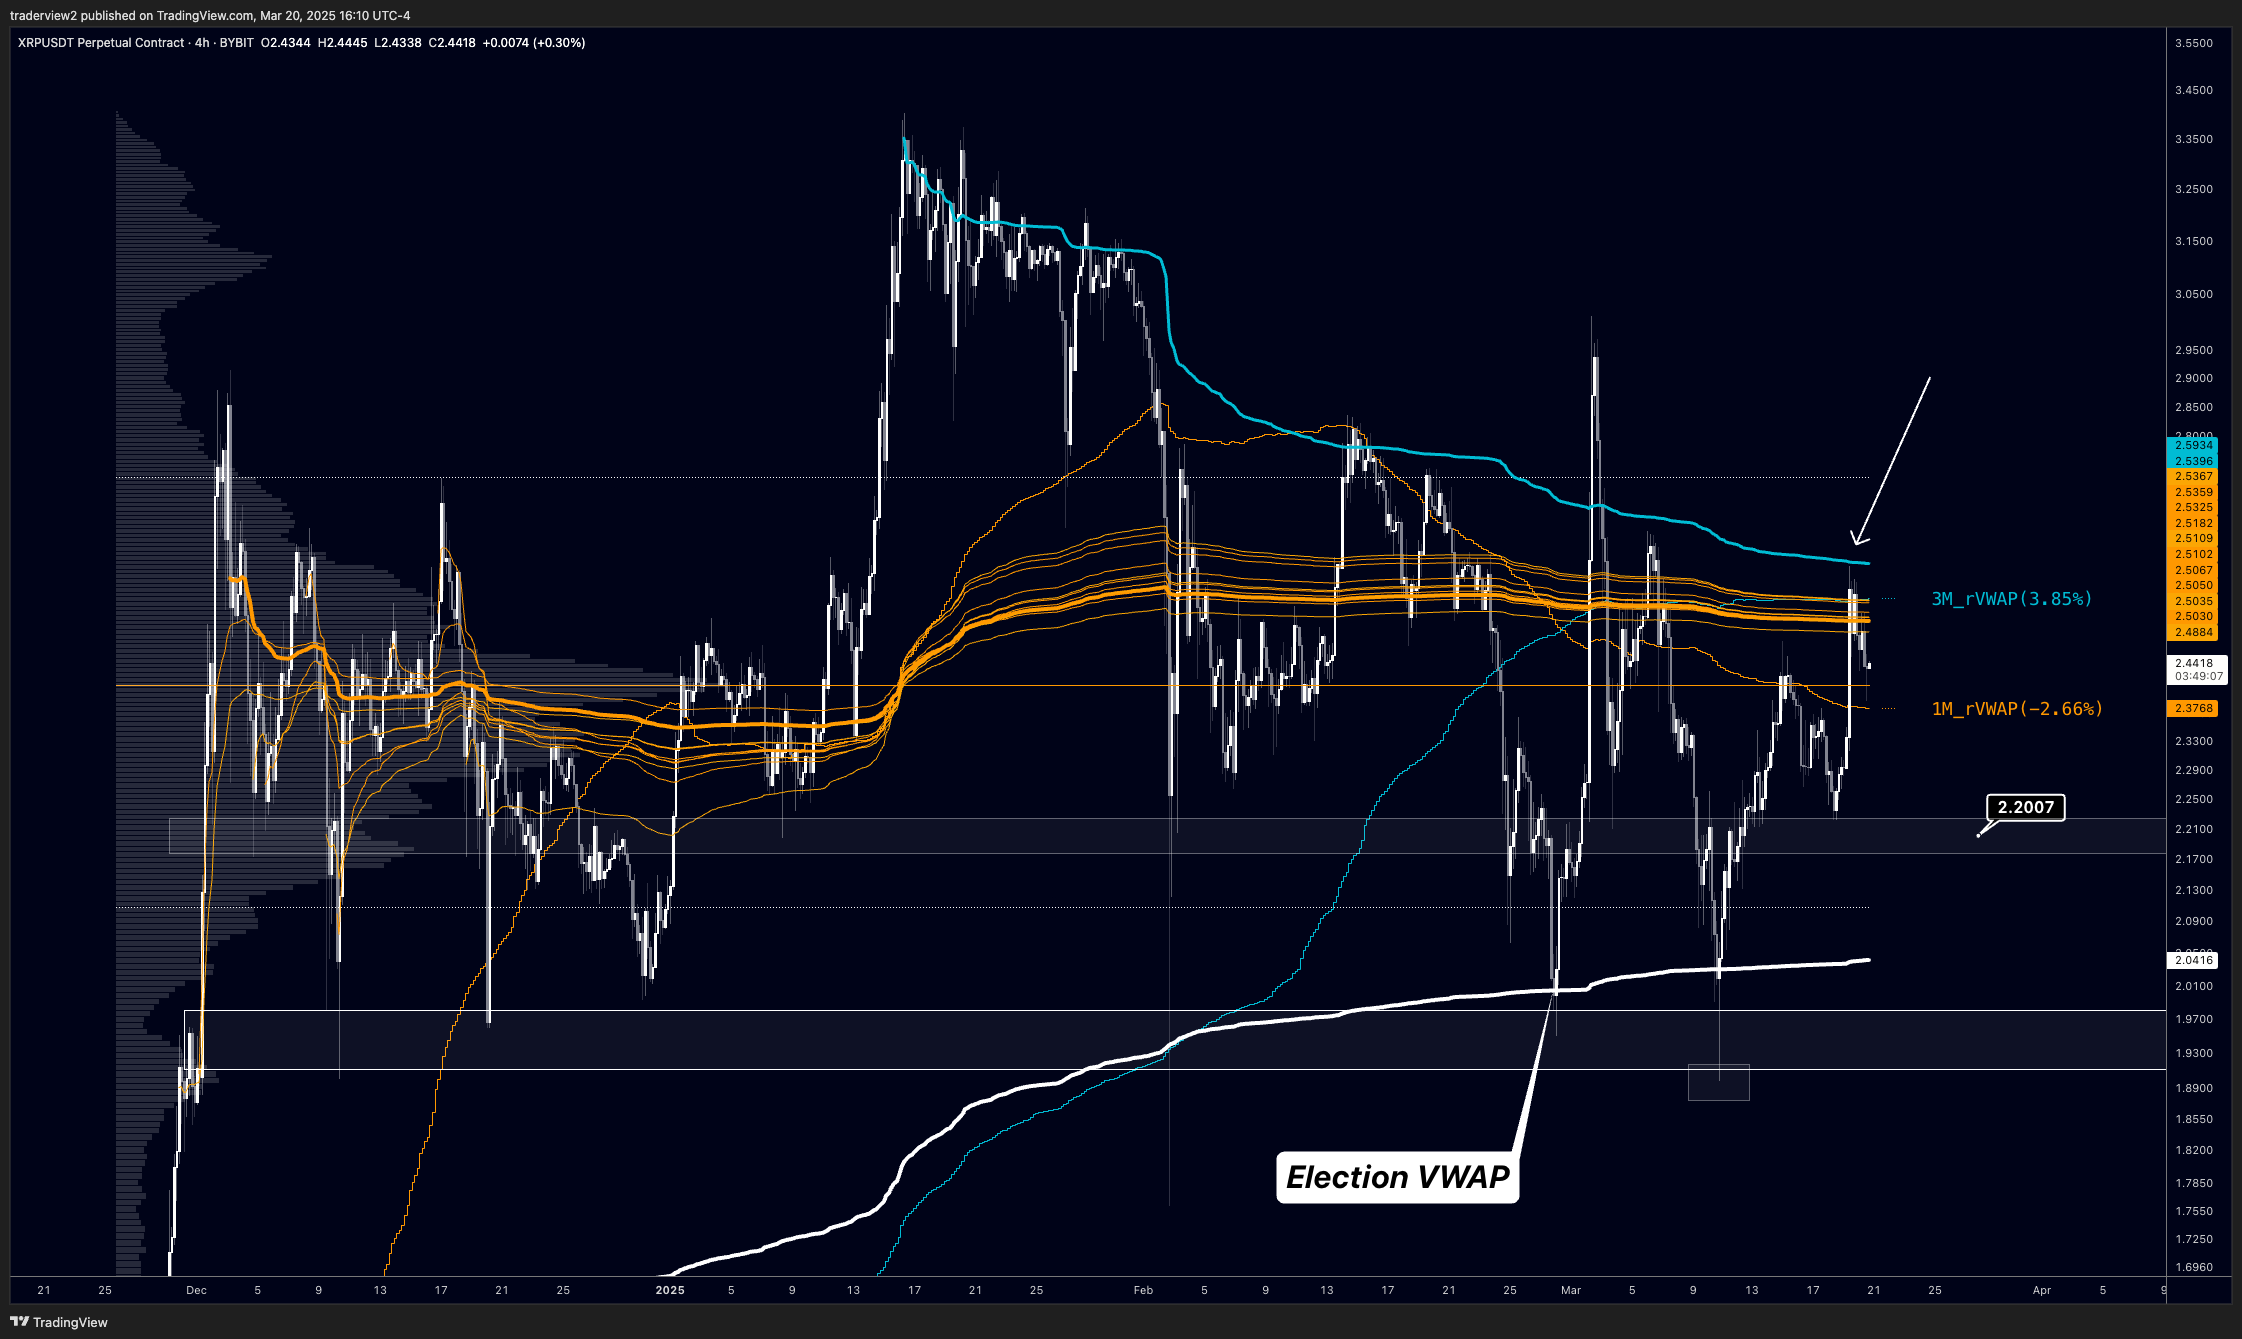
XRP/USD four-hour price chart. Source: TradingView/Dom
-
The Relative Strength Index (RSI) is trending above 60, indicating building bullish momentum without yet being in overbought territory.
XRP symmetrical triangle breakout looms
XRP is flashing a major bullish signal on its higher timeframe chart, with price action coiling within a symmetrical triangle that suggests a breakout rally may be on the horizon.
What to know:
-
A symmetrical triangle forms when the price consolidates inside a triangle-like structure after a strong uptrend or downtrend.
-
It typically resolves when the price breaks out in the direction of its previous trend, rising/falling by as much as the triangle’s maximum height.
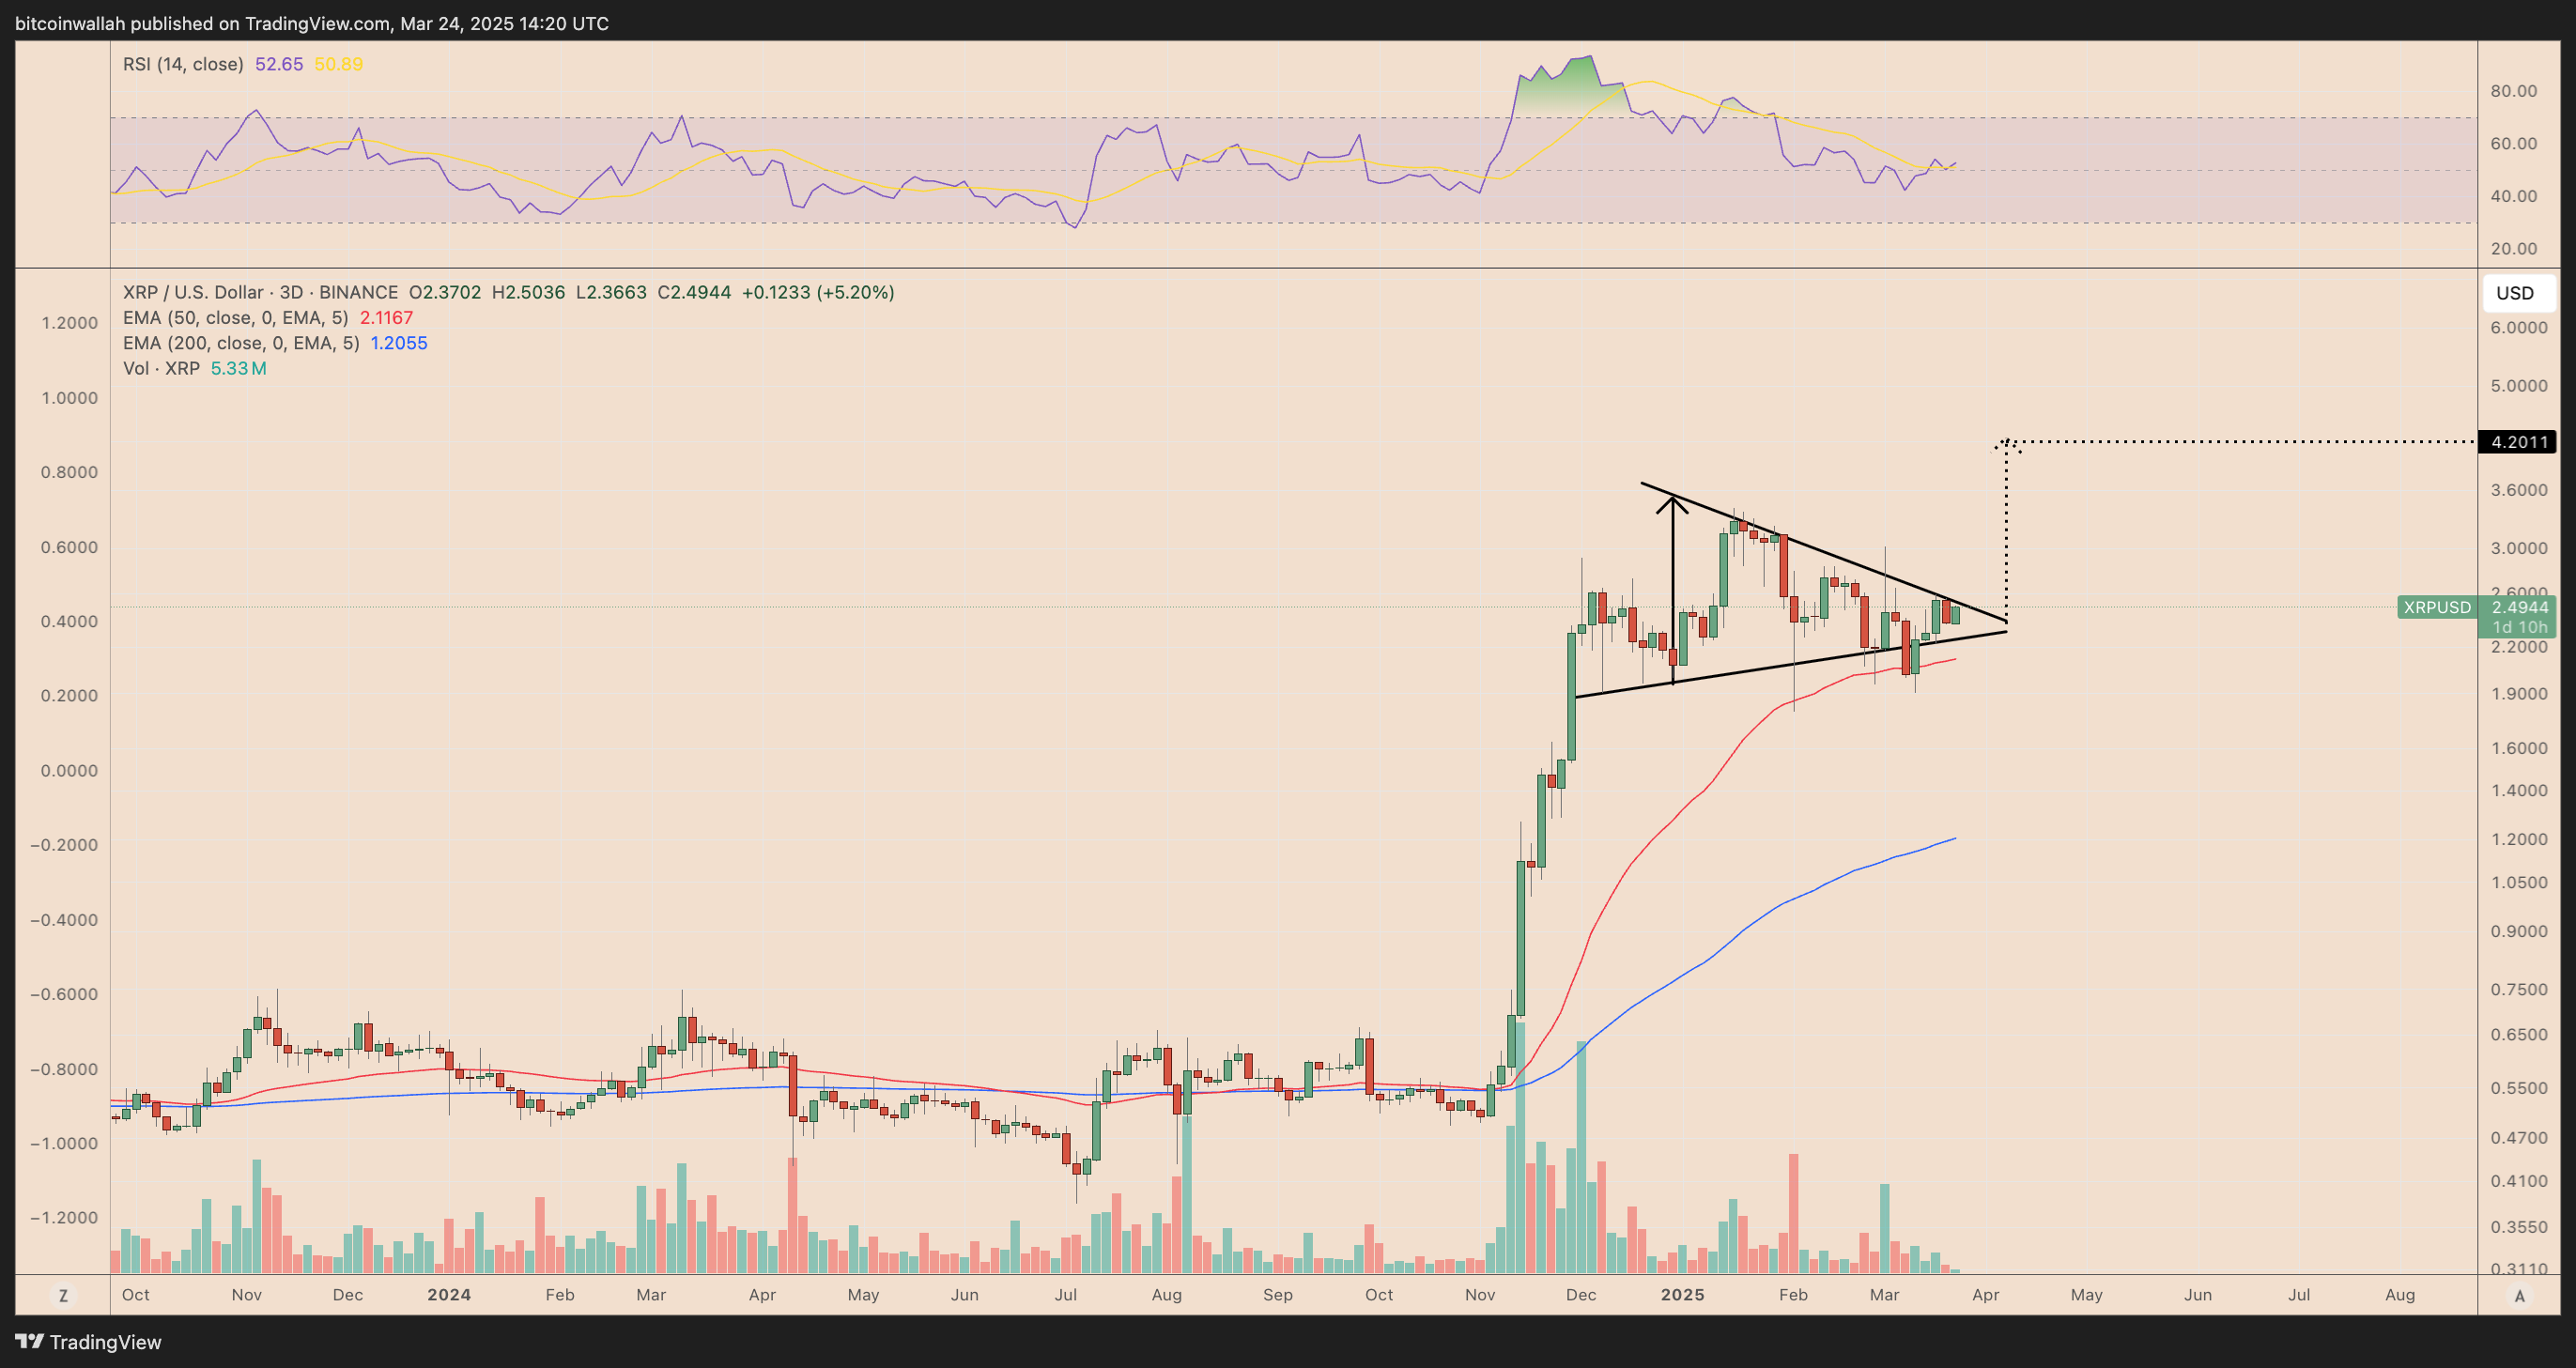
XRP/USD three-day price chart. Source: TradingView
-
The triangle pattern formed after XRP’s 575% rally between November 2024 and January 2025, raising the prospects of further gains in the coming weeks.
-
A successful breakout above the triangle’s upper trendline could send XRP’s price toward $4.20—up about 70% from the current price levels—by May.
-
Analyst CrediBULL Crypto also suggests that XRP is gearing up for a new all-time high above $3.40 in the coming weeks.
XRP liquidation heatmap shows $2.66-2.98 as next possible targets
The Binance XRP/USDT liquidation heatmap reveals key liquidity zones where large liquidation events may occur. These levels act as magnet zones, influencing price direction based on the amount of liquidity at a given level.
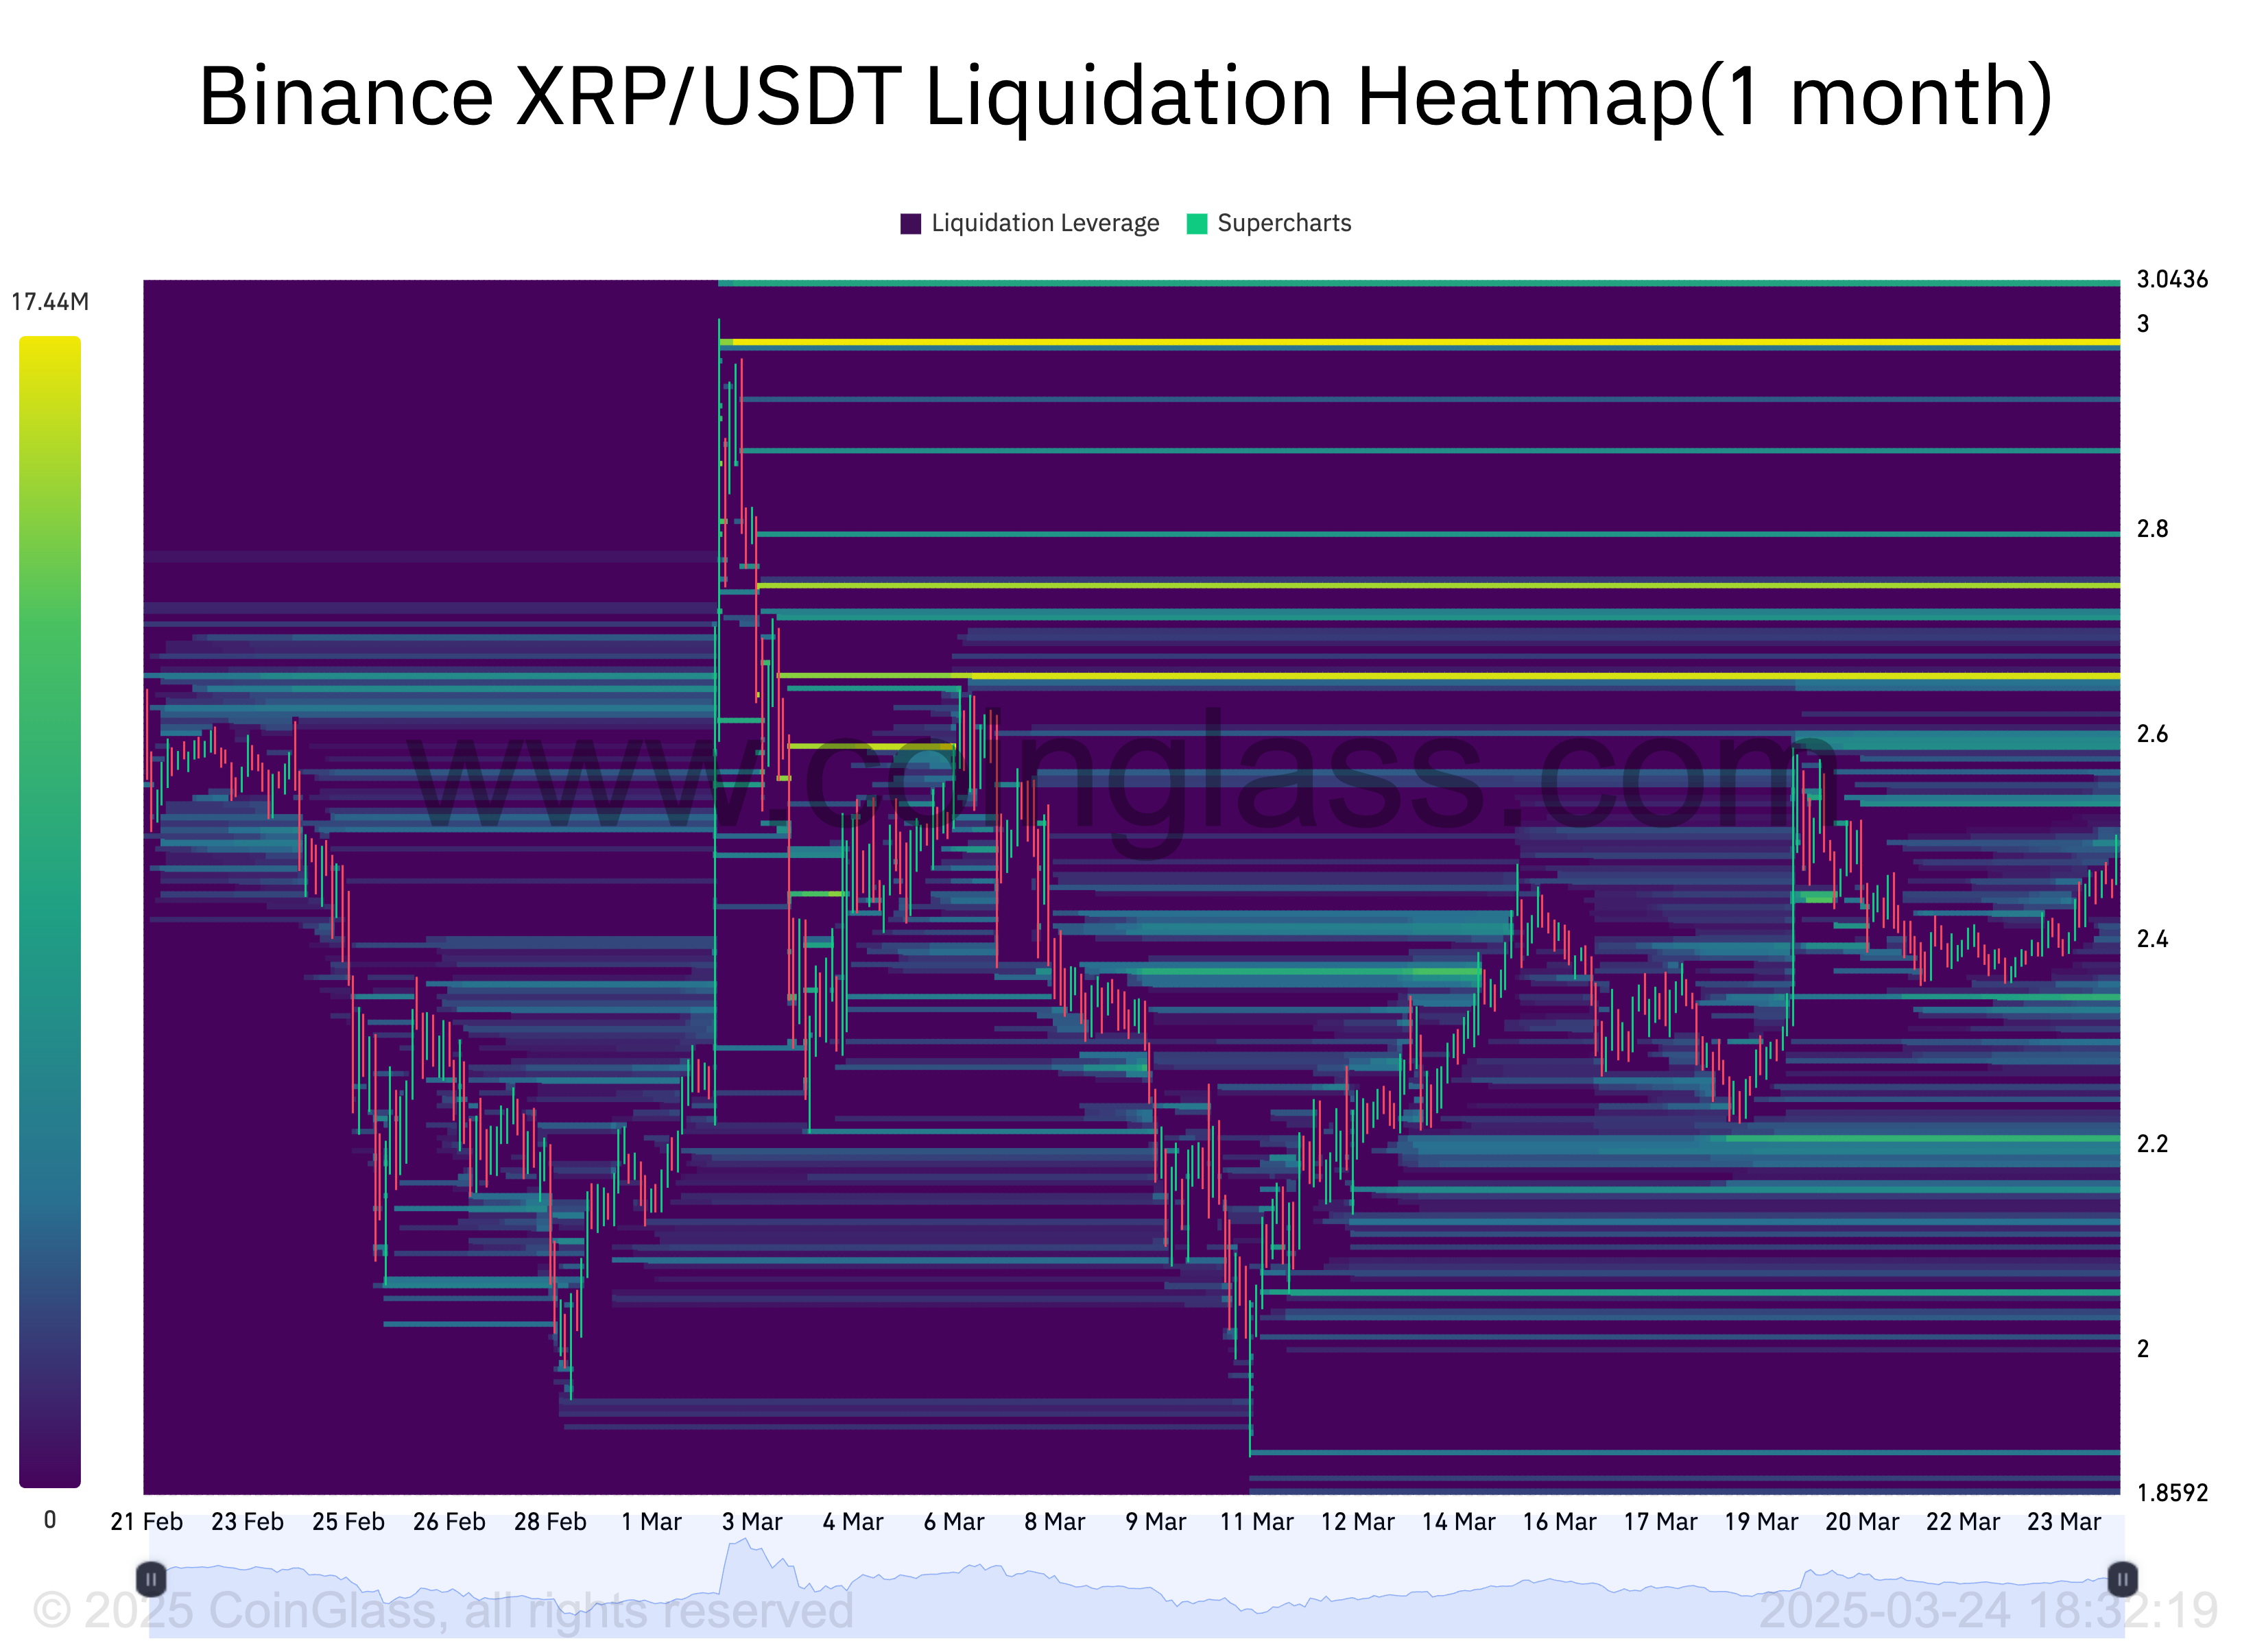
XRP/USDT one-month liquidation heatmap (Binance). Source: Coinglass
Key points:
-
A high concentration of liquidations is visible near $2.66, with the yellow area indicating a cluster of leveraged positions, suggesting it’s a key resistance level.
-
If $2.66 level is broken, it could spark a liquidation squeeze, forcing short sellers to close positions and driving prices toward $2.98, the next major liquidity cluster.
This article does not contain investment advice or recommendations. Every investment and trading move involves risk, and readers should conduct their own research when making a decision.
 ETF")

