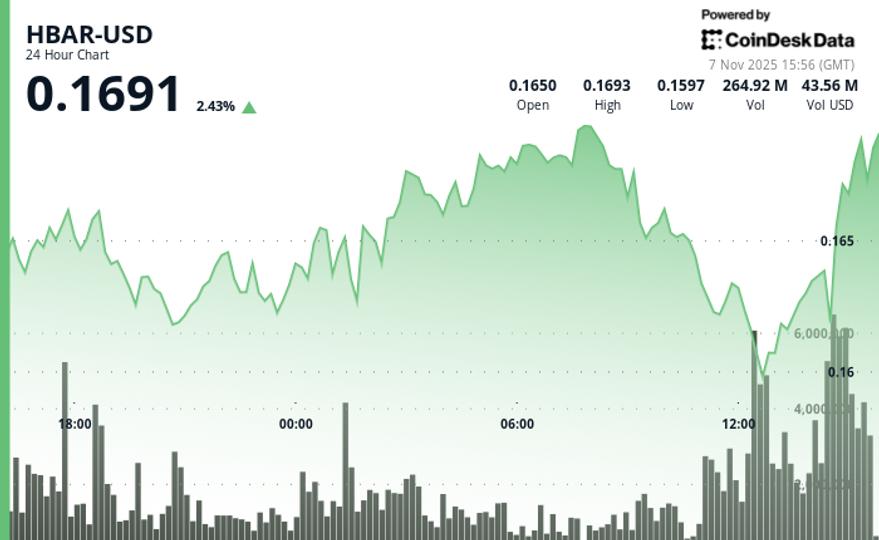
HBAR trades in volatile range-bound action during the 24-hour period ending Nov. 7, dropping from $0.1672 to $0.1634 for a 2.3% decline.
The most significant market activity occurred at 17:00 UTC on Friday, when volume surged to 108.8 million tokens—46% above the 24 hour simple moving average of 74.6 million.
HBAR’s lackluster price action on Friday is reflective of the wider market, with several tokens falling to multi-month lows amid a wave of sell pressure.
Hedera’s token has now retraced the entire uptrend dating back to July, signaling that the recent bullish market phase is over.
Natural profit-taking took place near $0.164 on Friday, with subsequent four minutes of zero volume suggesting a market pause at this technical level. This development represents a potential new resistance zone that aligns with the upper boundary of the day’s expanded trading range and negates the earlier bearish consolidation thesis.
Key Technical Levels Signal Mixed Outlook for HBAR
Support/Resistance:
- Primary support establishes at $0.1595-$0.1610 zone during decline phase
- Key resistance identified at $0.1662 level where recovery attempt fails
- New resistance emerges at $0.164 following late-session breakout
Volume Analysis:
- Peak institutional activity at 108.8M tokens (46% above 24-hour SMA)
- Late-session acceleration to 3.5M during breakout attempt
- Volume deceleration in closing hours suggests consolidation potential
Chart Patterns:
- Range-bound consolidation with 5.6% daily volatility
- Failed breakout at $0.1662 resistance level
- Late-session reversal negates bearish consolidation pattern
Targets & Risk/Reward:
- Immediate resistance at $0.164 following profit-taking
- Upside target toward $0.1672 daily open if resistance breaks
- Downside risk to $0.1595 support if current level fails to hold
Disclaimer: Parts of this article were generated with the assistance from AI tools and reviewed by our editorial team to ensure accuracy and adherence to our standards. For more information, see CoinDesk’s full AI Policy..


