
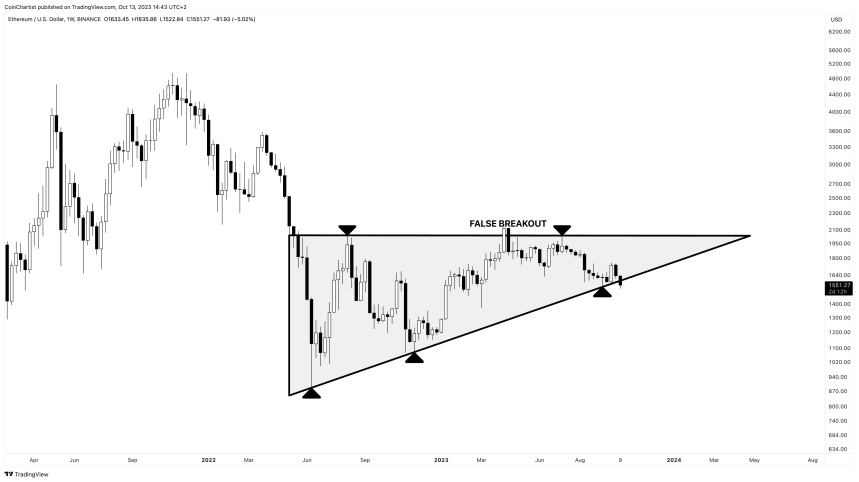
Ethereum price is trading at roughly $1,550 after failing to get back above $2,000 throughout the entirety of 2023 thus far. Increasingly higher lows during the year and a horizontal resistance zone had formed an ascending triangle – a potentially bullish chart pattern.
This pattern, however, is possibly failing. A busted pattern target could send the price per ETH sub-$1,000.
Is the bullish chart pattern breaking down? | ETHUSD on TradingView.com
Ethereum Ascending Triangle Begins Breakdown: Target $700
Ethereum put in its bear market low back in June of 2022 while Bitcoin and other coins kept falling through the end of the year. Despite the early lead in a bear market recovery, ETH has underperformed against BTC in 2023. Now it is at risk of falling to a new low with a target of deep below $1,000 if a presumed bullish pattern breaks down instead of up.
ETHUSD has been trading in what appears to be a textbook ascending triangle pattern since its 2022 local low. A series of increasingly higher highs has created an upward slowing trend line. A horizontal resistance zone across $2,000 has kept price action at bay. Volume has been trending downward throughout the course of the pattern. Price is at roughly two-thirds to the triangle apex.
Ether even had positive news at its back: the launch of the first Ethereum Futures ETFs. Yet it has failed to produce any meaningful upside, and is now trying to move back down causing the bullish pattern to bust. If the pattern does break downward, it would have a target of around $700 per ETH based on the measure rule.
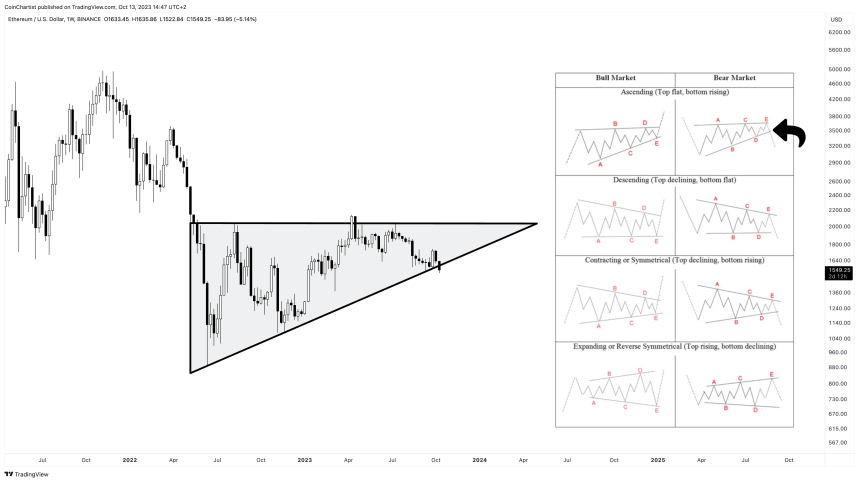
Or is the a bearish barrier triangle anyway? | ETHUSD on TradingView.com
Elliott Wave Explained: Golden Fibonacci Extension Targets $300 ETH
Although the ascending triangle is considered a bullish chart pattern, it only has a roughly 63% probability of breaking out, per the Encyclopedia of Chart Patterns by Thomas Bulkowski. The remaining 37% of the time break down. But technical analysis is a broad study. An ascending triangle to one trader, could be barrier triangle to another.
A barrier triangle is simply an ascending or descending triangle as defined by Elliott Wave Principle. In Elliott Wave Principle, triangles are especially telling. They only appear before the final move in a sequence. Because Elliott Wave labels waves with the trend as 1 through 5, triangles are corrective and appear only in the wave 4 place – just prior to wave 5 which ends the sequence.
In a bear market, corrective structures are labeled ABC. Triangles themselves can appear during a B wave, which once again, is ahead of the final move in the ABC count. C wave targets are often found by projecting the 1.618 Fibonacci ratio from the A wave. This makes the target of the busted pattern somewhere around $300 per ETH. Between the measure rule and the Fibonacci extension target, Ethereum could be facing sub-$1,000 prices in the future.
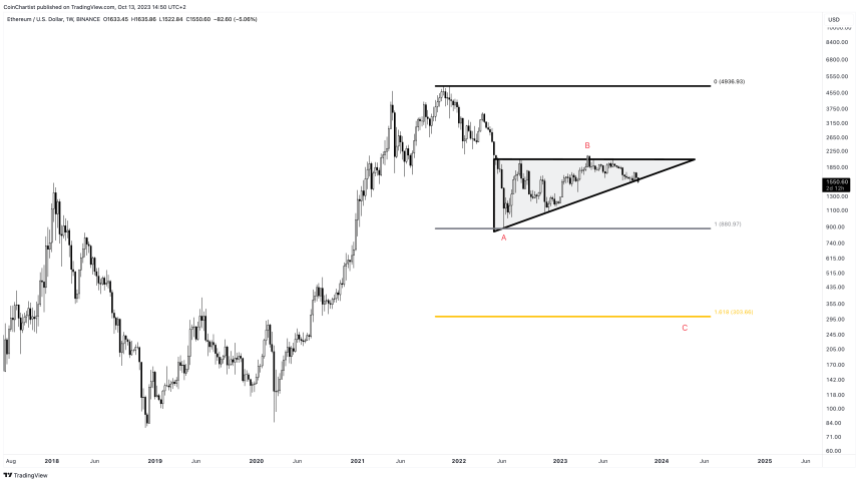
Could Ether fall sub-$1000? | ETHUSD on TradingView.com


