

Ethereum price corrected lower and tested the $1,935 support. ETH is likely forming a double-bottom and might start a decent increase.
- Ethereum reacted to the downside and tested the $1,935 support.
- The price is trading below $2,020 and the 100-hourly Simple Moving Average.
- There was a break below a key contracting triangle with support near $2,025 on the hourly chart of ETH/USD (data feed via Kraken).
- The pair is likely forming a double-bottom pattern and might outperform Bitcoin.
Ethereum Price Revisit $1,935
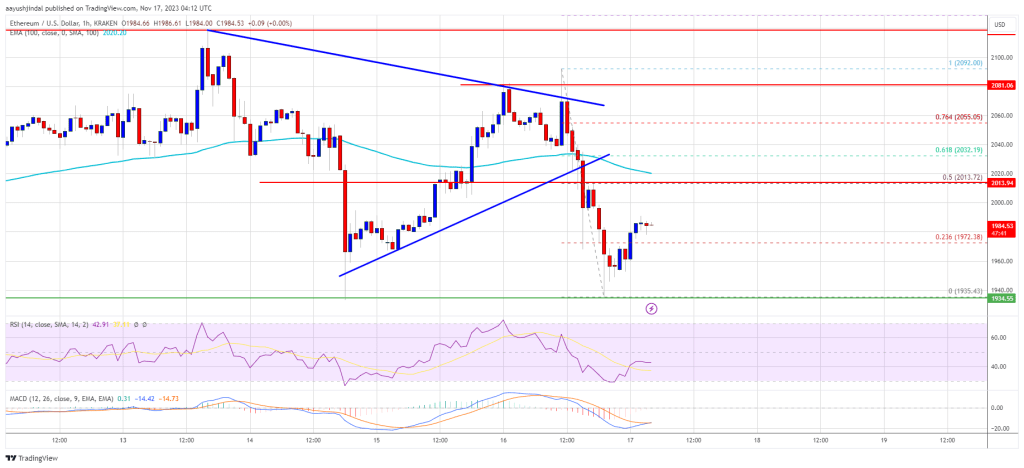
After facing rejection near the $2,090 zone, Ethereum price reacted to the downside. ETH traded below the $2,050 and $2,020 support level to enter a short-term bearish zone, like Bitcoin.
There was also a break below a key contracting triangle with support near $2,025 on the hourly chart of ETH/USD. However, the bulls took a stand near the $1,935 support zone. It seems like Ether is likely forming a double-bottom pattern, while Bitcoin is forming a double-top near $38,000.
Ethereum is now trading above the 23.6% Fib retracement level of the downward move from the $2,092 swing high to the $1,935 low. Immediate resistance is near the $2,000 zone.
The first major resistance is near $2,020 or the 100-hourly Simple Moving Average. It is near the 61.8% Fib retracement level of the downward move from the $2,092 swing high to the $1,935 low. A close above the $2,020 resistance could start another strong increase.
Source: ETHUSD on TradingView.com
The next resistance is near $2,090, above which the price could aim for a move toward the $2,120 level. Any more gains could start a wave toward the $2,200 level.
More Losses in ETH?
If Ethereum fails to clear the $2,020 resistance, it could start a fresh decline. Initial support on the downside is near the $1,950 level. The next key support is $1,935.
The main support is $1,920. A downside break below the $1,920 support might start a steady decline. In the stated case, Ether could drop toward the $1,850 support zone in the near term. Any more losses might call for a drop toward the $1,800 level.
Technical Indicators
Hourly MACD – The MACD for ETH/USD is losing momentum in the bullish zone.
Hourly RSI – The RSI for ETH/USD is now below the 50 level.
Major Support Level – $1,935
Major Resistance Level – $2,020


