

- ETH price is currently under pressure and is trading below the $175 level against the US Dollar.
- The price is trading above the $170 support area, but it is struggling to climb higher.
- There is a major contracting triangle forming with support near $170 on the hourly chart of ETH/USD (data feed via Kraken).
- A downside break below the $170 support might spark a strong decline towards $165 or $160.
Ethereum price is preparing for the next move versus the US Dollar, while consolidating vs bitcoin. ETH price must stay above the $170 support to avoid another drop.
Ethereum Price Analysis
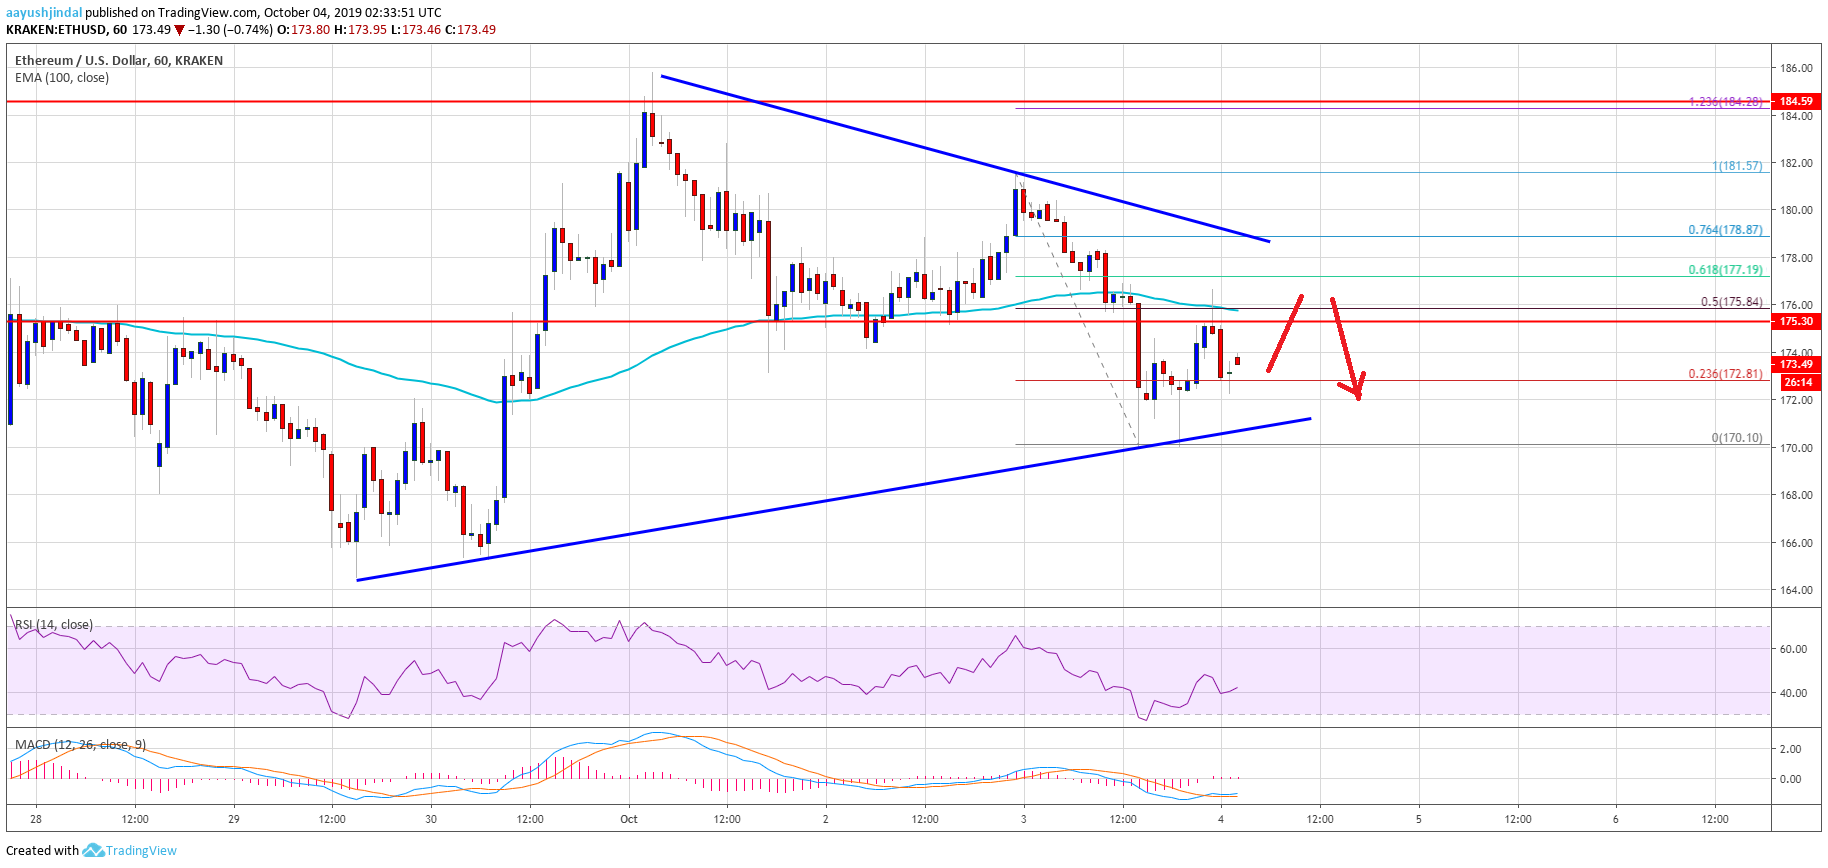
Yesterday, there was an upward move above the $178 level in Ethereum against the US Dollar. ETH price even traded above the $180 resistance and the 100 hourly simple moving average. However, the bulls failed to push the price further higher and it remained well below the $185 resistance. A swing high was formed near the $182 level and the price recently declined below $180 and $178.
Moreover, there was a break below the $175 support area and the 100 hourly SMA. The decline was such that the price even broke the $172 support. Finally, it tested the $170 support area. The bears made two attempts to push the price below the $170 support, but they failed to gain strength. As a result, there was an upside correction above the $172 level.
The price broke the 23.6% Fib retracement level of the recent drop from the $182 high to $170 low. However, the previous support near the $175 level and the 100 hourly SMA is currently acting as a resistance. Additionally, the 50% Fib retracement level of the recent drop from the $182 high to $170 low is also acting as a solid resistance. More importantly, there is a major contracting triangle forming with support near $170 on the hourly chart of ETH/USD.
If there is a downside break below the $170 support, the price could continue to decline. The next key support is near $165, below which the price is likely to test $160. Conversely, an upside break above $182 and $185 is needed for bullish acceleration.
Looking at the chart, Ethereum price is clearly preparing for the next move either above $185 or below $170. As long as the price is below the $175 pivot level and the 100 hourly SMA, there is a risk of a downside break.
ETH Technical Indicators
Hourly MACD – The MACD for ETH/USD is slowly moving into the bullish zone.
Hourly RSI – The RSI for ETH/USD is currently just above the 40 level, with a positive angle.
Major Support Level – $170
Major Resistance Level – $182


