

- Ripple price struggled to break the $0.2550 resistance and declined recently against the US dollar.
- The price is trading below $0.2500 and it seems like it could slowly decline towards $0.2400.
- There was a break below a connecting bullish trend line with support near $0.2475 on the hourly chart of the XRP/USD pair (data source from Kraken).
- The price could accelerate lower if there is a break below the $0.2420 and $0.2400 support levels.
Ripple price is under pressure below $0.2500 against the US Dollar, similar to bitcoin. XRP price must break $0.2500 and $0.2550 to start a strong upward move.
Ripple Price Analysis
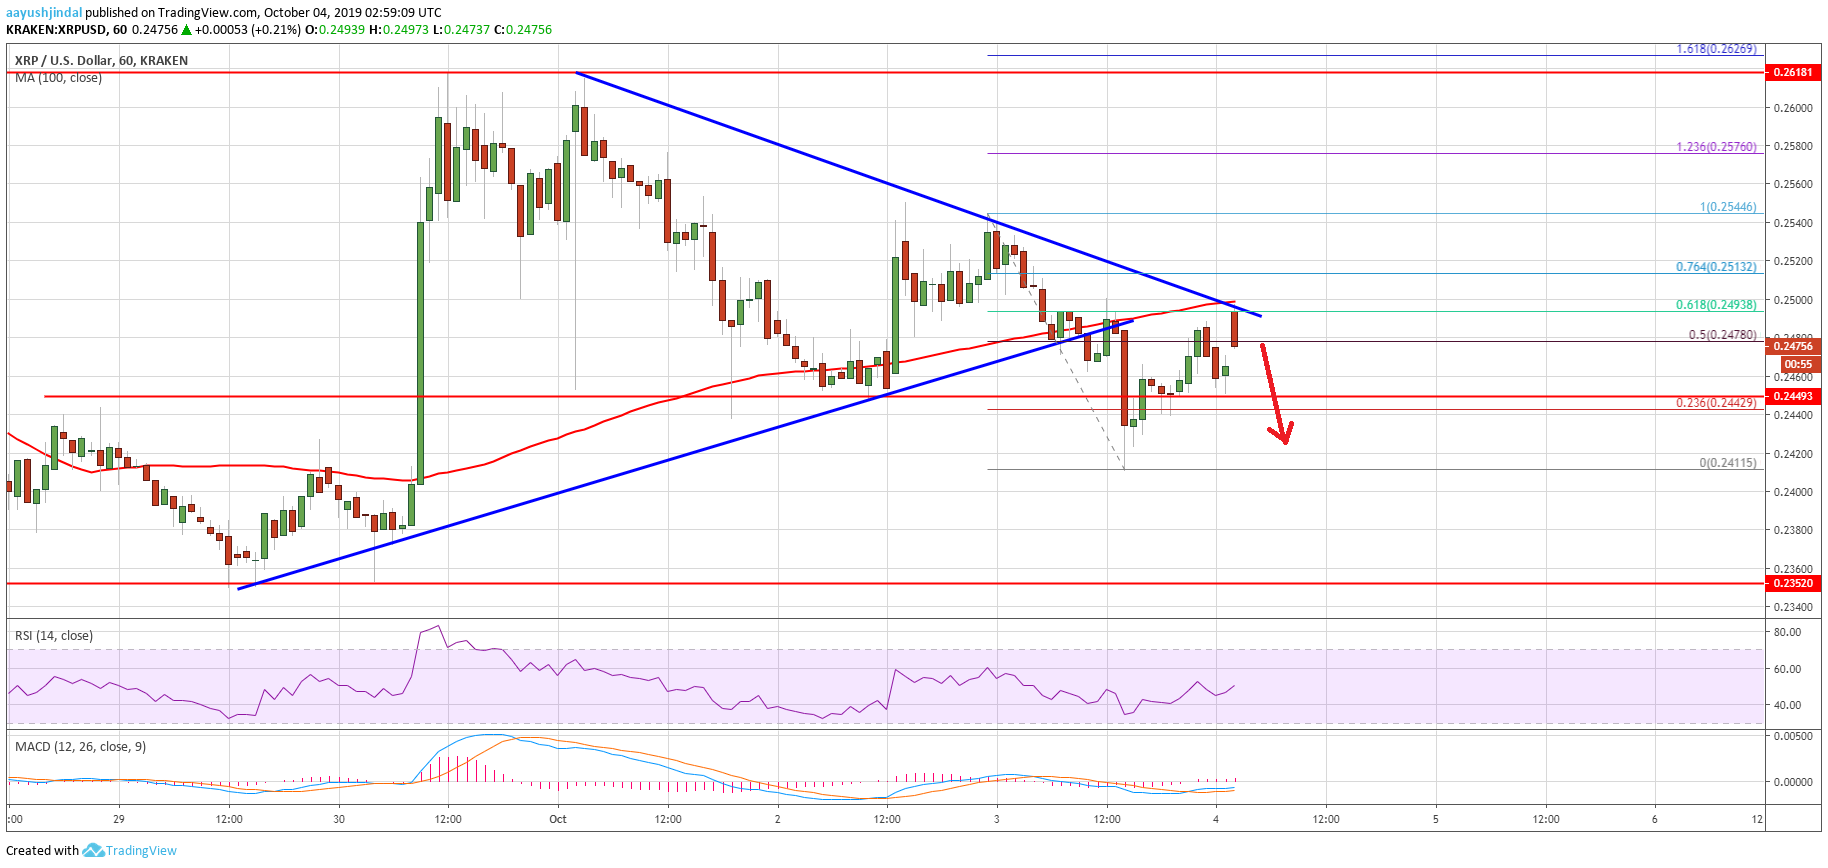
Yesterday, ripple price made a couple of attempts to surpass the $0.2550 resistance against the US Dollar. However, the XRP/USD pair failed to gain strength above $0.2550 and recently declined. It broke the $0.2500 and $0.2480 support levels. Moreover, there was a close below the $0.2500 level and the 100 hourly simple moving average.
During the decline, there was a break below a connecting bullish trend line with support near $0.2475 on the hourly chart of the XRP/USD pair. The pair tested the $0.2420 support area and it is currently correcting higher. It broke the $0.2450 level, plus the 50% Fib retracement level of the recent decline from the $0.2544 high to $0.2415 low. However, the previous support near the $0.2500 level and the 100 hourly simple moving average are currently preventing an upside break.
Moreover, the 61.8% Fib retracement level of the recent decline from the $0.2544 high to $0.2415 low is acting as a resistance. There is also a connecting bearish trend line forming with resistance near $0.2500 on the same chart. Therefore, an upside break above the $0.2500 level might start a fresh increase. The next key resistance is near the $0.2550 level, above which the price could test the main $0.2620 resistance.
On the downside, an immediate support is near the $0.2450 level, followed by $0.2420. If there is a bearish break below the $0.2420 and $0.2400 support levels, the price may perhaps retest the main $0.2350 support in the near term.
Looking at the chart, ripple price is clearly trading in a bearish zone below $0.2550 and the 100 hourly SMA. It seems like there could be another dip towards the $0.2400 or $0.2350 support level. On the upside, the bulls need to gain strength above $0.2550 and $0.2620 for bullish continuation.
Technical Indicators
Hourly MACD – The MACD for XRP/USD is slowly moving into the bullish zone.
Hourly RSI (Relative Strength Index) – The RSI for XRP/USD is currently near the 50 level, with bearish signs.
Major Support Levels – $0.2420, $0.2400 and $0.2350.
Major Resistance Levels – $0.2500, $0.2550 and $0.2620.


