

Bitcoin price has spent the last two years hovering around $10,000 – a key resistance level that in the past has incited serious FOMO. But according to an early Bitcoin investor who has seen a thing or two, the cryptocurrency won’t hover around that price forever and sees parallels between the current price action compared the calm before the breakout into the last bull market.
Early Crypto Investor: Bitcoin Can’t Hover Around $10,000 Forever
The world will know soon enough if scarcity-focused valuation methods like the stock-to-flow model continue to hold true for Bitcoin. But if they are accurate, the lowered block reward miners now receive in BTC should begin to force Bitcoin prices higher due to lower supply flow.
Natural supply and demand dynamics then begin to sway in favor of price increase, and the asset forms a bubble. And there’s no reason to think otherwise – that’s exactly what the cryptocurrency did several times now.
After the cryptocurrency’s halving in 2016, the asset spent what to crypto investors at the time felt like forever trading below $600. When Bitcoin finally took out that level and left it behind, the crypto asset never looked back.
Related Reading | Bitcoin Crossroads Made Clear By Two Remaining Lines in The Sand
Instead, it plowed right along through every next psychological resistance level imaginable, until it slammed headfirst into $20,000 at peak exuberance and hype.
The same thing is happening once again, but this time at $10,000. An early Bitcoin investor who experienced this for themself had dug up an old tweet to show the parallels between each market cycle and where things may potentially be at this time around.
The tweet was from almost exactly four years earlier, and if the every-four-year halving-based theories are correct, Bitcoin is about to take off just like it did last time around.
In no future does bitcoin forever hover around $10,000. Long-term it’s either $0 or $100,000K+ https://t.co/YNMd852BcJ
— Stephen Cole (@sthenc) September 11, 2020
Nothing In Between: $100,000 Plus, Or All The Way Down To Zero
The same Bitcoin investor both then and now does warn, however, that there’s no middle-ground for the cryptocurrency. It either goes on to fulfill the potential tech enthusiasts and savvy investors see as the future of money, or it fails miserably.
Stephen Cole, the early Bitcoin investors who compares $600 to $10,000, back then suggested that the asset would either crash to zero, or trade at $10,000 or more. Clearly he was right.
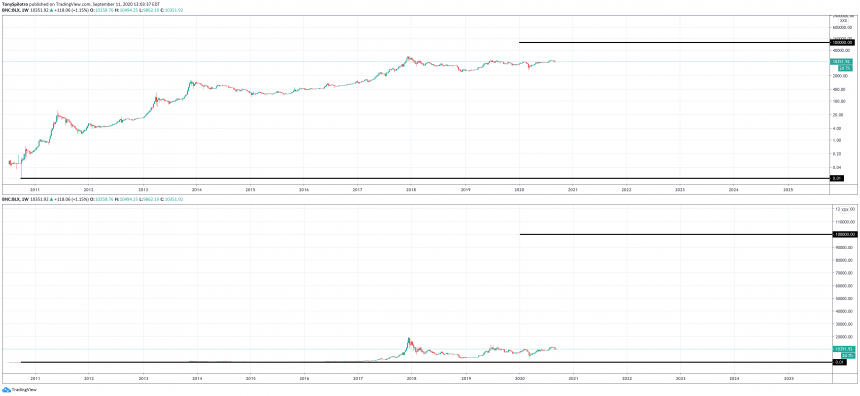
BTCUSD Weekly Log Scale and Linear Scale Zero Versus $100K Comparison | Source: TradingView
This time, he says that it is either zero, or $100,000, with no chance for in outcome somewhere in between. But which will it be? On the log scale, Bitcoin is a lot closer to $100,000 than zero, but on linear scale its a heck of a lot shorter of a distance down than up to such highs.
Related Reading | This Unique Perspective Makes It Clear Bitcoin Cycles Are Lengthening
Interestingly, there could be some reasoning behind $600 and $10,000 acting so similarly as key levels dor each bear market. Why? Because its the 0.5 Fibonacci retracement level, or almost exactly 50% from the asset’s two most recent bull market peaks: $1,200 and $20,000.
It is not clear why markets behave this way, but there’s certainly something more to math and numbers than meets the eye. In fact, yet another important number is coming up this Sunday. Keep watch on NewsBTC for an update on what this crucial number means and why its a big deal to Bitcoin.


