

Key Notes
- Over $128 million worth of DOGE was accumulated by whales in the last 48 hours.
- DOGE trades at $0.16 with a market cap of $23.7 billion.
- Technical indicators mirror past breakout setups, signaling a possible strong upside.
After a bearish start to April, the leading meme coin, Dogecoin (DOGE), has recorded a fresh round of whale accumulation amid bullish predictions. Currently trading around $0.16, DOGE boasts a market cap of $23.7 billion.
On-chain data shared by popular analyst Ali Martinez reveals that whales have scooped up over 800 million DOGE, worth approximately $128 million, in just the past two days.
Whales bought more than 800 million #Dogecoin $DOGE in the last 48 hours! pic.twitter.com/swQV3RYevT
— Ali (@ali_charts) April 15, 2025
This aggressive buying activity comes as multiple analysts have recently hinted at an imminent breakout.
TA Trader Alan recently explained to his 72,000 X followers that DOGE is mirroring similar patterns on MACD and RSI as seen in the final stages of its previous pullbacks. He believes the meme coin is poised for a strong upside move “soon.”
#Dogecoin Final Stage of Pullback 🔥$Doge is showing the same characteristics on the MACD and RSI as it did in the last stage of previous pullbacks.
As it nears the end of this pullback, $Doge is set to pump SOON 🚀 pic.twitter.com/Ls23cmX0nR— Trader Tardigrade (@TATrader_Alan) April 15, 2025
According to on-chain data by Coinglass, the DOGE open interest-weighted funding rate has just started to tick upward. This suggests that some optimism is returning among leveraged traders.
DOGE OI-Weighted Funding Rate | Source: Coinglass
However, open interest itself has remained mostly flat since early February, indicating that traders are still hesitant to commit to large directional bets.
Doge price outlook
On the daily DOGE price chart, the MACD leans bearish at the moment, with the signal line still hovering above the MACD line. However, analysts argue that a bullish crossover, if backed by volume, could quickly flip the narrative in favor of the bulls.
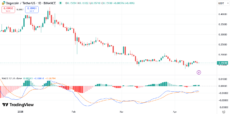
DOGE Daily Price Chart | Source: Trading View
Meanwhile, the RSI is currently at 45, indicating mild bearish pressure without being in oversold territory. A further dip in RSI could open the door for more losses, while an upward move may trigger a recovery rally.
DOGE Daily Price Chart | Source: Trading View
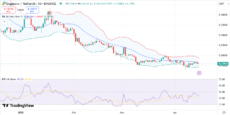
The Bollinger Bands are widening, a signal of heightened volatility. The price is approaching the mid band (20-day SMA) at $0.16. If the coin holds this level, it could see a short-term rally to the upper band (around $0.18925).
A breakout above the upper band could send the coin toward new local highs. On the other hand, the lower band sits around $0.148, and failure to hold this level might trigger deeper pullbacks.
On April 13, popular chartist Javon Marks suggested that DOGE is aligning with a historical pattern that previously led to a multi-hundred percent rally.
$DOGE (Dogecoin) looking ready to put on yet another magical bullish performance to NEW ALL TIME HIGHS!
This can result in an AT-LEAST +200% to +330% move above $0.73 ⤴️… pic.twitter.com/tCRCtPzrGq
— JAVON⚡️MARKS (@JavonTM1) April 13, 2025
On the bi-weekly chart, he predicts a potential increase of at least 200–330% that could push DOGE beyond its previous all-time high of $0.73.
Disclaimer: Coinspeaker is committed to providing unbiased and transparent reporting. This article aims to deliver accurate and timely information but should not be taken as financial or investment advice. Since market conditions can change rapidly, we encourage you to verify information on your own and consult with a professional before making any decisions based on this content.

A crypto journalist with over 5 years of experience in the industry, Parth has worked with major media outlets in the crypto and finance world, gathering experience and expertise in the space after surviving bear and bull markets over the years. Parth is also an author of 4 self-published books.


