

There is a common belief that when the U.S. dollar declines relative to other main global currencies, as measured by the Dollar Strength Index (DXY), the impact on Bitcoin (BTC) is positive, and vice versa.
For instance, the DXY index dropped from 103.0 on Jan. 2017 to a 92.6 low on Aug. 2017, while Bitcoin rallied from $1,000 to $4,930 in the same period. But is there enough evidence to justify a bull run similar to 2016–17, as some analysts are arguing?
But is there enough evidence to justify a bull run similar to 2016–2017, as some analysts are arguing?
Is the Bitcoin-dollar inverse trend real?
Traders and influencers frequently warn about this negative correlation and how a reversal of DXY will likely push the Bitcoin price higher.
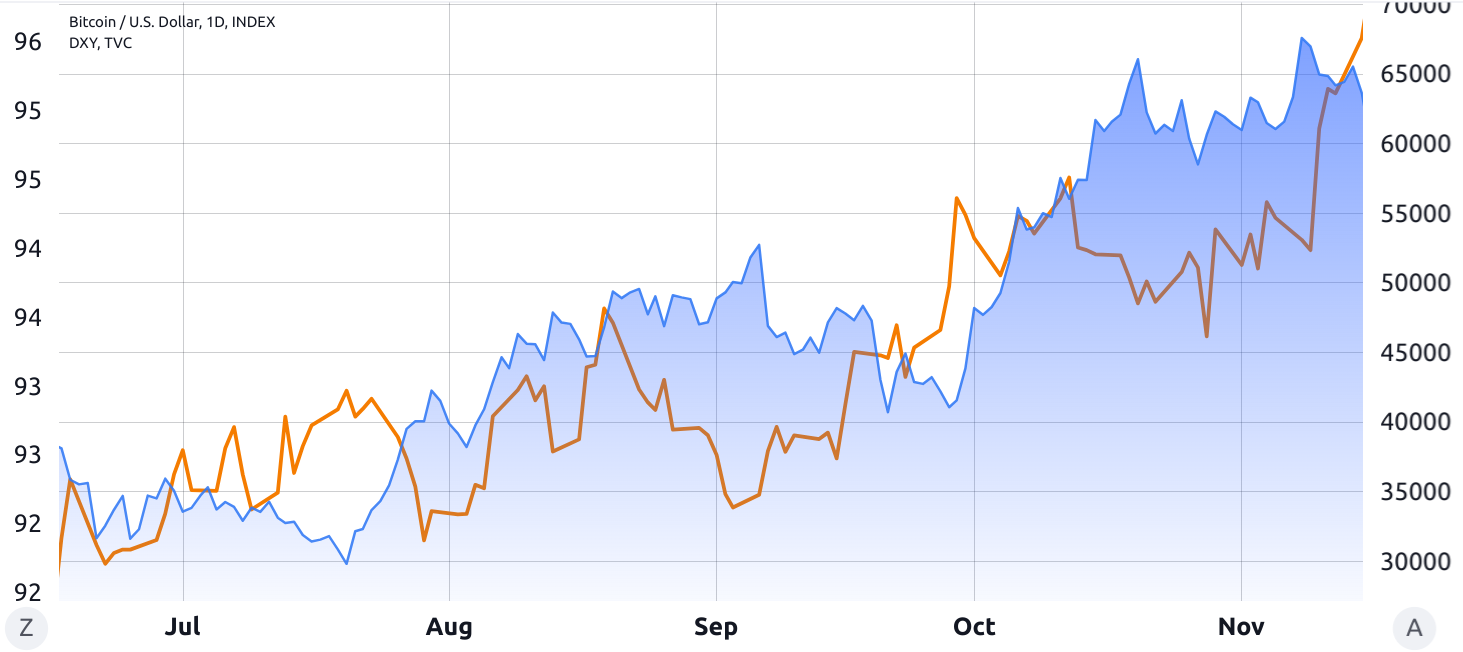
Investment research @GameofTrades_ recently posted a chart presenting the pattern in early 2023 and then repeating itself later in May. There’s some indisputable evidence of the inverse correlation there.
Bitcoin and DXY have maintained a negative correlation year-to-date in 2023 pic.twitter.com/VTePX3PNs6
— Game of Trades (@GameofTrades_) June 22, 2023
Moreover, technical analyst el_crypto_prof presents a bearish “Gaussian Channel” change on the DXY chart, which, according to the analysis, matched two previous bull runs for Bitcoin and altcoins in 2016–17 and 2020–21.
The DXY (US Dollar Index) has changed the color from green to red on the Gaussian Channel.
The last two times this happened, $BTC and Altcoins experienced a bullrun (parabola) in the following months (2016-2017 and 2020-2021).
Sounds exciting, doesn’t it? pic.twitter.com/kHJeM6iZDH
— ⓗ (@el_crypto_prof) June 26, 2023
BTC-DXY correlation varies with time
The seemingly inverse relationship between Bitcoin and DXY have never lasted more than 7 weeks. The correlation indicator runs from -100%, indicating that certain markets move in opposite ways, to 100%, indicating that the movement is in lockstep; 0 represents a total lack of correlation between the two assets.
The metric has been negative for 81% of the past 670 days, indicating that DXY and Bitcoin have generally followed an inverse trend. Still, that’s not how the correlation metric works, because readings between 0% and -50% denote a lack of correlation.
In fact, the longest-ever period of a correlation lower than -50% has been the 47 days starting on Aug. 18, 2022. Therefore, saying that Bitcoin has an inverse correlation to the DXY index would be statistically incoherent since it was -50% or lower for less than a third of the days since September 2021.
Between June 2021 and November 2021, the DXY and BTC price presented a very similar pattern as both rallied during that five-month period.
Events solely relevant to the cryptocurrency might have distorted the metric, however, such as the first U.S. Bitcoin futures exchange-traded fund launch on October 19, 2021.
But regardless of the rationale behind the move, correlation is not causation, meaning it is impossible to conclude that DXY’s positive performance affected Bitcoin price during the period.
Related: Will BlackRock’s ETF slingshot Bitcoin’s price skyward?
Longer-term analysis still required for DXY
Even though analysts and market influencers frequently use 20-day correlation data to explain daily price fluctuations, a longer time frame is required to comprehend any potential, if any, effects of DXY on Bitcoin’s price.
For instance, when the U.S. Federal Reserve injects trillion-dollar stimulus packages into the economy, odds are the impact on inflation and global currency flows will take a couple of weeks. After all, not every family, business, and financial institution will put the money in circulation right away.
But the price signals on the Bitcoin market are more immediate as coins are traded 24/7. So the price movements are extremely susceptible to news, macroeconomic data, and geopolitical events, with reverberating effects for weeks and even months.
A perfect example can be demonstrated by Bitcoin’s 38% loss in nine days on June 8, 2022.
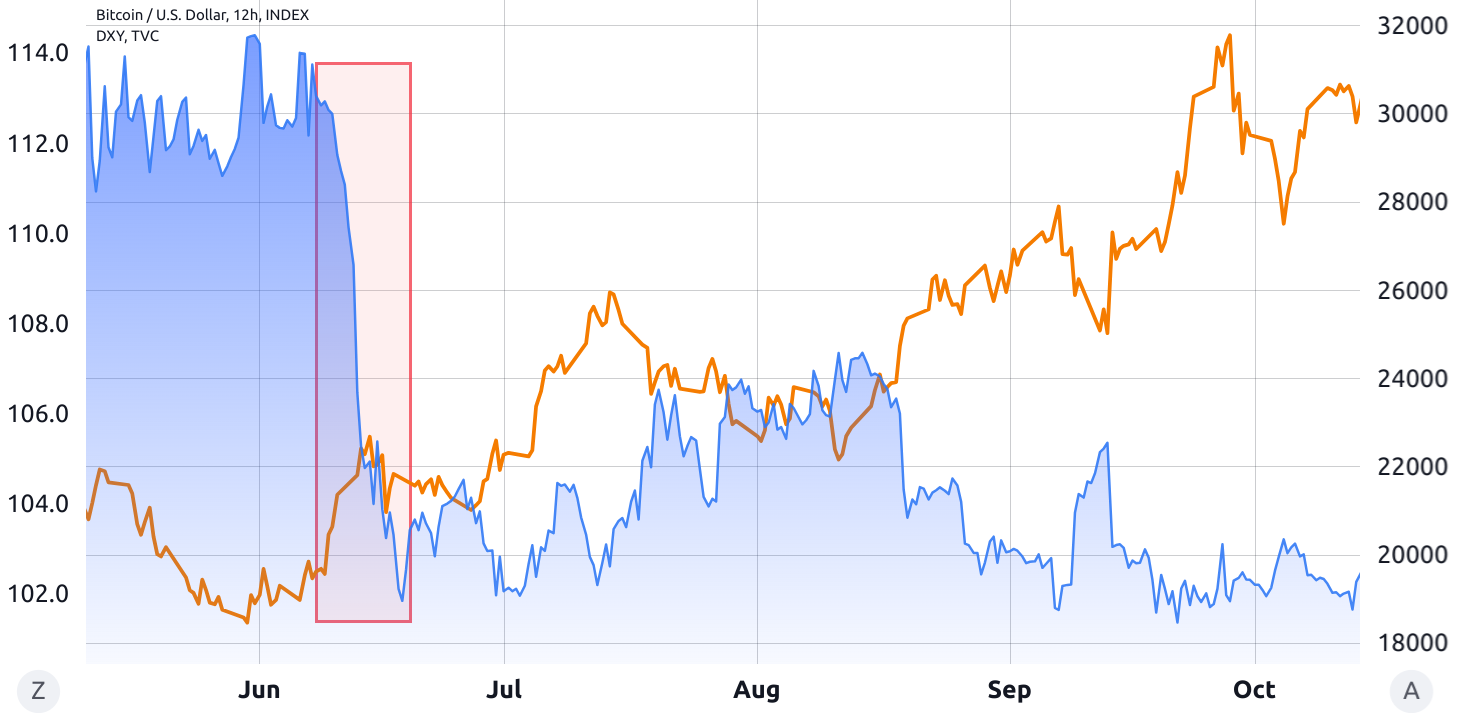
Notice how it took almost 4 months for the DXY index to move from 102.50 to the 114.2 peak by late Sept. 2022, even though Bitcoin had already bottomed at $18,900 long before that.
DXY a poor proxy for BTC price
In other words, those betting on the DXY index reversal preceding a BTC price rally have no statistical support given that the correlation varies over time.
Moreover, even when the inverse correlation happens, there may be a gap between Bitcoin’s immediate price action and the longer term trends of the Dollar Strength Index.
Whenever favorable (or unfavorable) developments in the cryptocurrency industry occur, the historical correlation becomes irrelevant. That might have been the case impacting the recent Bitcoin gains, which can’t be directly attributed to the supposed “Gaussian Channel” reversion on the DXY chart.
Ultimately, cherry-picking two or three instances of DXY index inverse correlation happening while a cryptocurrency bull run occurred in the past is not enough to call a bull run similar to 2016–17, considering the multiple instances of positive correlation and gaps between both assets’ price action.
This article is for general information purposes and is not intended to be and should not be taken as legal or investment advice. The views, thoughts, and opinions expressed here are the author’s alone and do not necessarily reflect or represent the views and opinions of Cointelegraph.


