
Key Notes
- BNB Chain completed its Lorentz testnet hard forks with mainnet hard forks scheduled for late-April.
- Lorentz upgrade reduces opBNB block times to 0.5s and BSC testnet to 1.5s.
- BNB Coin breaks out of a year-old ascending triangle, suggesting bullish momentum.
The BNB Chain successfully executed the Lorentz testnet hard forks, a development poised to bring faster transaction speeds and improved blockchain responsiveness.
This coincides with the ecosystem’s native cryptocurrency, BNB Coin (BNB), breaking out of an year-old ascending triangle range, hinting at a possible rally.
The update, revealed in a tweet posted on April 10, reduces opBNB block times down to 0.5 seconds and BSC testnet blocks to 1.5 seconds.
The Lorentz testnet hardforks are complete!
opBNB is now running at 0.5s block times & BSC testnet is live with 1.5s block times
Faster blocks. Smoother performance. Now it’s time for mainnet:
🔸 opBNB → April 21 @ 03:00 AM UTC
🔸 BSC → April 29 @ 05:05 AM UTCHere’s… pic.twitter.com/ntWe1gIJqc
— BNB Chain (@BNBCHAIN) April 10, 2025
Notably, opBNB, a layer-2 scaling solution built atop BSC, aims to tackle the congestion and scalability challenges. With this hard fork, developers and users are set to experience smoother and faster operations.
The BNB team has urged all node operators and dApp developers to upgrade their systems and test application compatibility for a seamless integration.
According to the official schedule, the opBNB mainnet hardfork is scheduled for April 21 at 03:00 AM UTC, followed by the BSC mainnet hardfork on April 29 at 05:05 AM UTC.
If the upgrades roll out successfully, the chain’s overall throughput could see a major uptick.
BNB Price Outlook
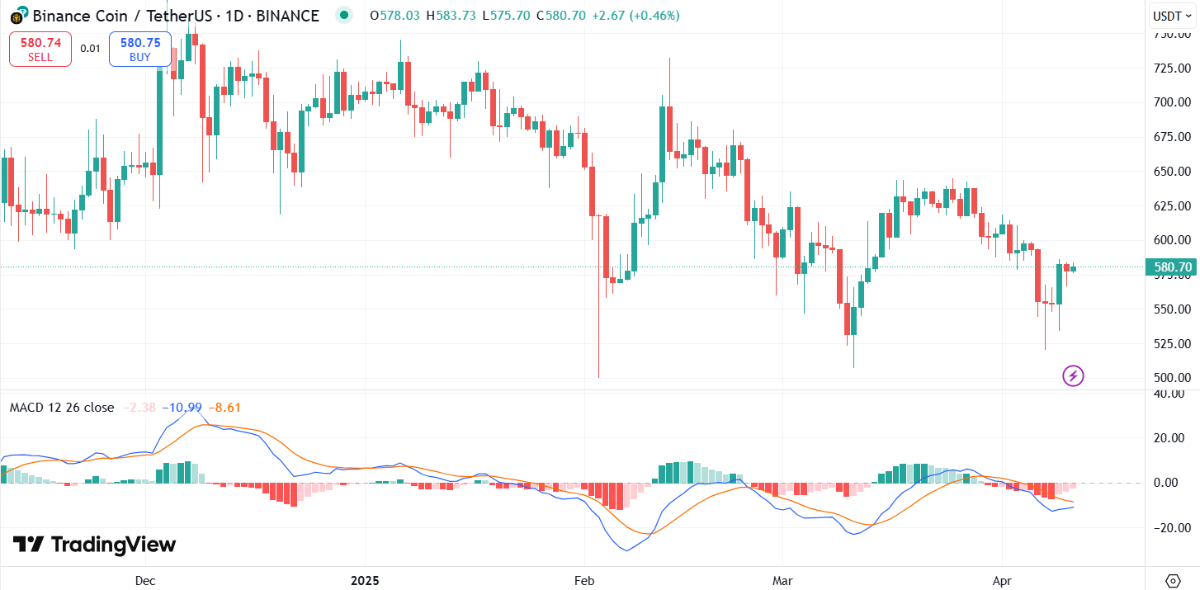
After a 4.5% rise to $579, BNB has been trading steadily around that level with no significant change in the past 24 hours. It remains the fifth-largest cryptocurrency by market cap, with a market cap of $82.59 billion.
On the daily BNB price chart, the RSI is hovering around 45, suggesting ample room for upward motion. Holding above 50 would confirm bullishness with a near-term resistance level at $590.
BNB Price Chart. Source: TradingView
Meanwhile, the price is consolidating around the middle Bollinger Band (20-day SMA). A sustained hold above this level could result in a test of $632, while a downside move below $575 risks falling toward the $550 region.
On the other hand, the MACD shows a negative narrowing histogram, suggesting that selling pressure may be losing steam. A bullish crossover here could act as a catalyst for further upward momentum.
Source: TradingView
Breakout Hopes
Popular crypto analyst Jonathan Carter recently noted that BNB has been trading within an ascending channel since March 2024. Interestingly, the token recently rebounded from the top boundary of this range.
Binance Coin is trading within an ascending channel and is currently bouncing from the upper channel boundary on the daily chart🧐
A successful continuation could push $BNB towards targets at $640, $735, $795 and possibly $960🚀 pic.twitter.com/1uZIjZPx2V
— Jonathan Carter (@JohncyCrypto) April 10, 2025
According to the analyst, if the rally continues, BNB could aim for targets at $640, $735, $795, and even $960 in the longer term.
Disclaimer: Coinspeaker is committed to providing unbiased and transparent reporting. This article aims to deliver accurate and timely information but should not be taken as financial or investment advice. Since market conditions can change rapidly, we encourage you to verify information on your own and consult with a professional before making any decisions based on this content.

A crypto journalist with over 5 years of experience in the industry, Parth has worked with major media outlets in the crypto and finance world, gathering experience and expertise in the space after surviving bear and bull markets over the years. Parth is also an author of 4 self-published books.

 Pops 8% Higher — Can The Momentum Continue?")
