

Bitcoin (BTC) made a new 52-week high on June 23, indicating that bulls are on fire. Buyers have managed to hold on to a large part of the gains made during the week, signaling that they are in no hurry to book profits. Bitcoin climbed 16% this week, outperforming the S&P 500 Index, which fell 1.39%.
Not only Bitcoin but even Ether (ETH) is showing signs of starting a bullish move. Glassnode data shows that Ether balances on exchanges dropped sharply in the past 30 days and hit a new low of 12.6%.
A similar dip in Ether exchange balances happened in November 2022, which was followed by a sharp rally of 33%. Although a rally is possible, traders need to be cautious because the fall in exchange balances this time may have been triggered by the Securities and Exchange Commission’s actions against Binance and Coinbase.
The crypto recovery is not limited to Bitcoin and Ether. Several altcoins have risen sharply from their respective lows, indicating solid buying at lower levels. This indicates that the bearish sentiment may be waning.
Could the return of the buyers start a new bull move in cryptocurrencies or will higher levels attract selling by the bears? Let’s study the charts of the top-5 cryptocurrencies that may rise in the short term.
Bitcoin price analysis
Bitcoin has been trading near the $31,000 level for the past four days. This suggests that the bears are protecting this level but the bulls have not given up. Usually, a tight consolidation near a major resistance level tends to resolve to the upside.
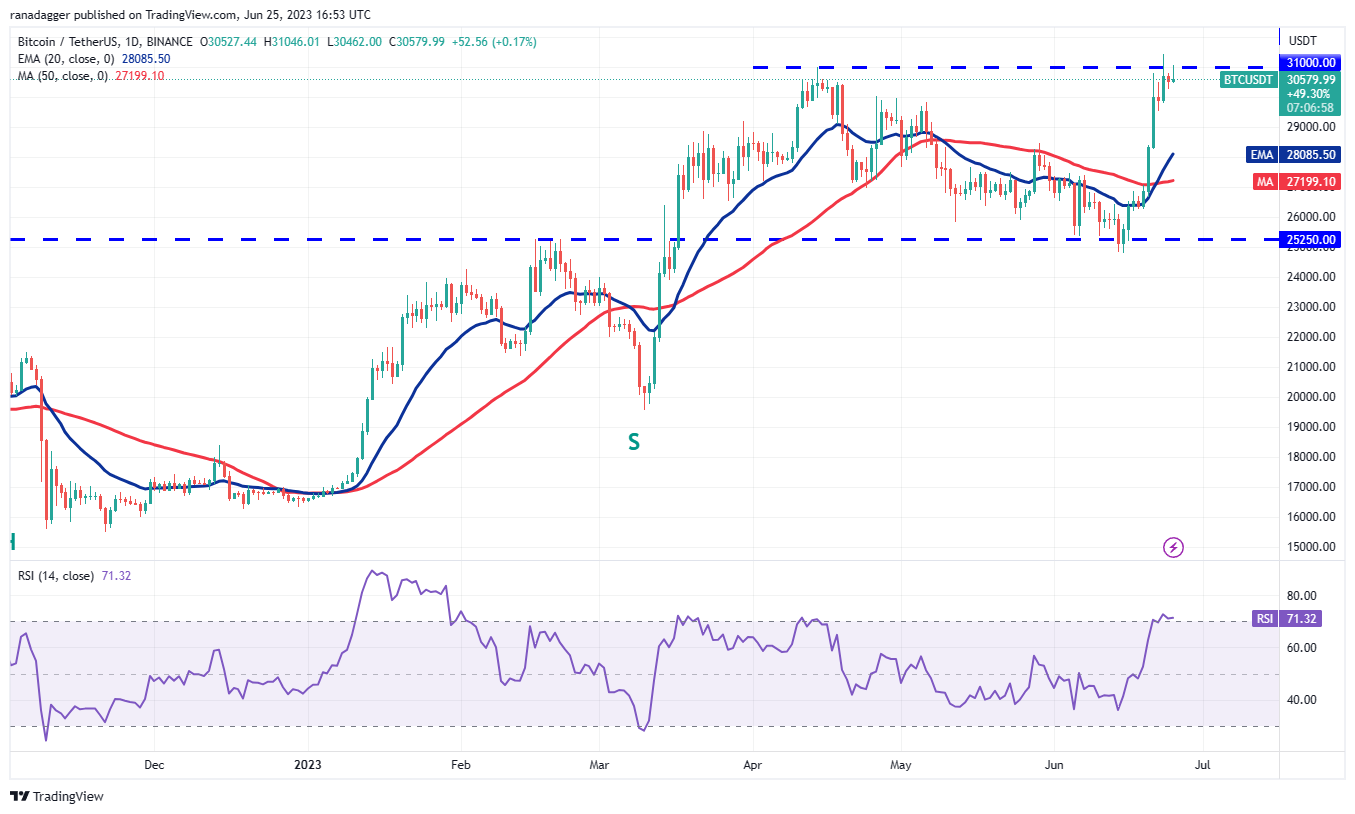
The upsloping 20-day exponential moving average ($28,085) and the RSI in the overbought area indicate advantage to the bulls. If buyers kick and sustain the price above $31,000, the BTC/USDT pair could start the next leg of the up-move. There is a resistance at $32,400 but that is likely to be crossed. The pair may then skyrocket toward $40,000.
The first sign of weakness will be a break and close below $29,500. If that happens, the pair may slide to the 20-day EMA. This remains the key level to keep an eye on because if it gives way, the pair may drop to the 50-day simple moving average ($27,199).
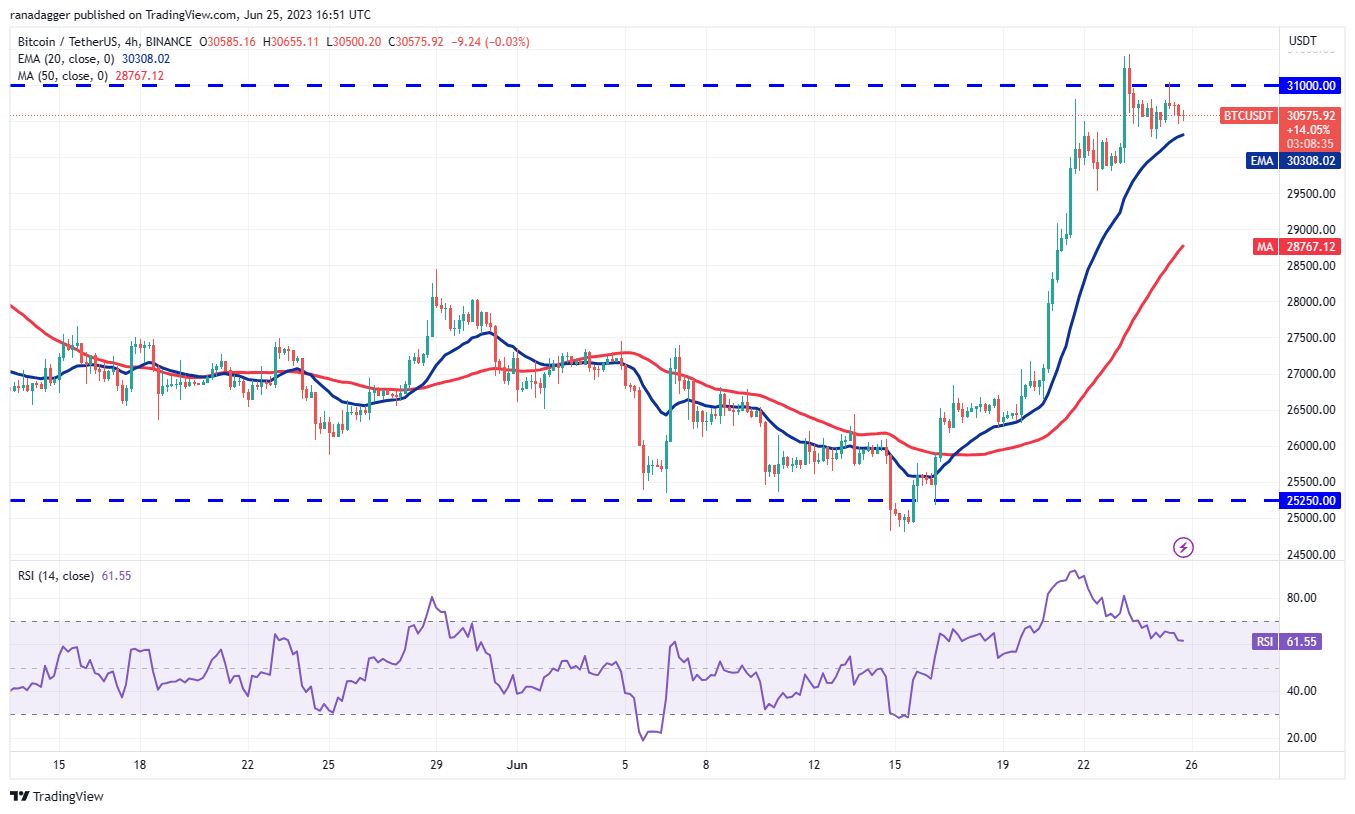
The pair is stuck between the 20-EMA and $31,000 but this tight-range trading is unlikely to continue for long. A range break above the $31,000 to $31,500 zone could start the next leg of the uptrend.
Conversely, if the price dips and sustains below the 20-EMA, it may trigger the stops of the short-term traders. The pair could then descend to $29,500 where the bulls are expected to mount a strong defense. A break below this level could open the doors for a potential fall to the 50-SMA.
Ether price analysis
Ether has been facing selling at the $1,928 level for the past three days but the bulls are not willing to cede ground to the bears. This indicates that buyers expect the resistance to be broken.
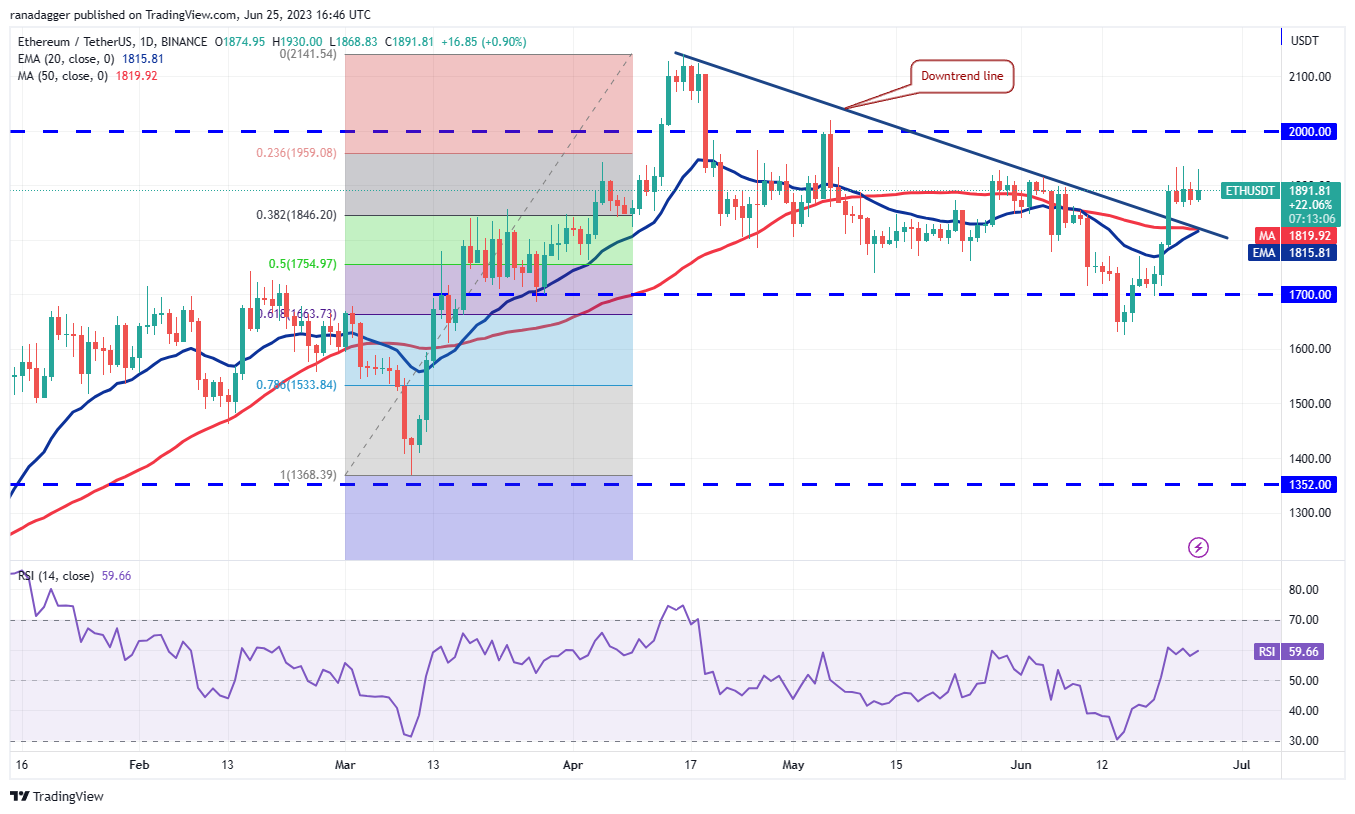
The moving averages are on the verge of a bullish crossover and the RSI is in positive territory indicating that the bulls are in command. If buyers overcome the barrier at $1,928, the ETH/USDT pair may surge to the overhead zone between $2,148 and $2,200.
If bears want to prevent the rally, they will have to quickly drag the price below the moving averages. That may hit the stops of the aggressive bulls, resulting in a correction to the strong support at $1,700.
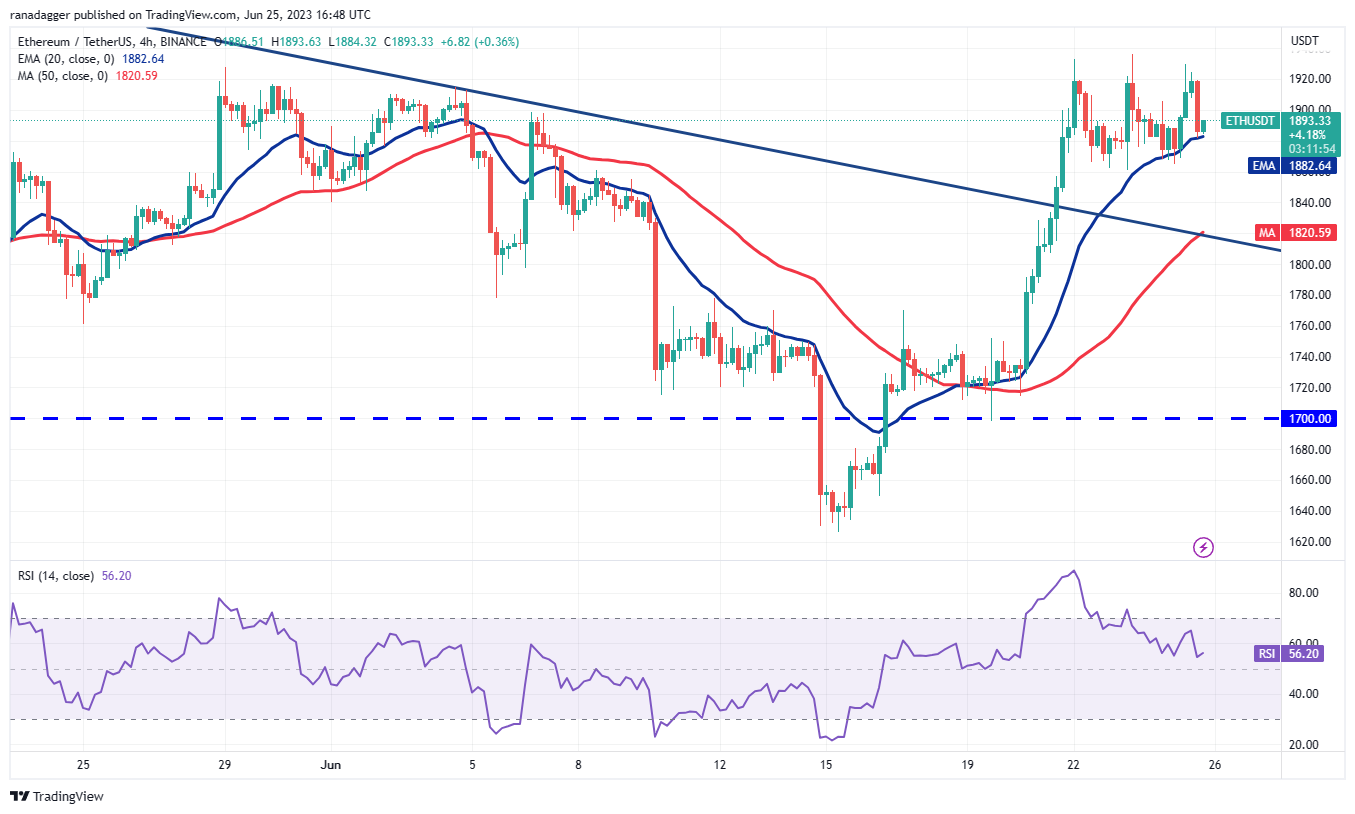
The 4-hour chart shows that the price is stuck inside the range between $1,936 and $1,861. The rising moving averages and the RSI in the positive zone suggest that the path of least resistance is to the upside. If buyers propel the price above the range, the pair could start its march to the psychological level of $2,000.
Instead, if the price turns down and breaks below the $1,861 support, it will tilt the short-term advantage in favor of the bears. The pair may then tumble to the 50-SMA and later to $1,750.
Arbitrum price analysis
Arbitrum (ARB) rose above the breakdown level of $1 on June 19 and followed that up with a sharp rally on June 20. This indicates rejection of the recent breakdown.
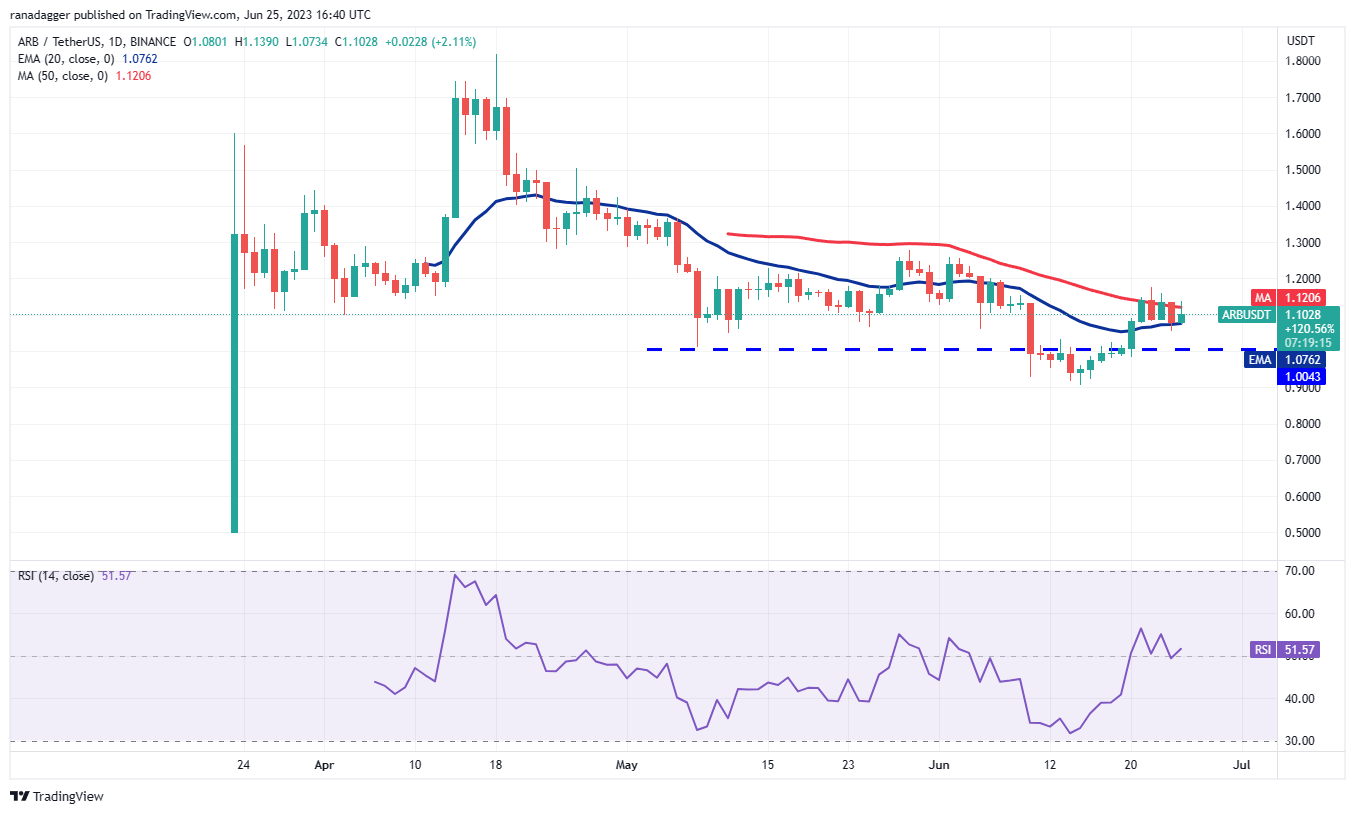
The bears are trying to stall the recovery at the 50-day SMA ($1.12) but a positive sign is that the bulls have successfully defended the 20-day EMA ($1.07). This narrow range trading is unlikely to continue for long and a breakout may be expected soon.
A break and close above $1.18 could suggest the start of a new up-move. The ARB/USDT pair could first rise to $1.28 and subsequently to $1.54. This bullish view will be negated if the price turns down and plunges below the $1 to $0.90 support zone.
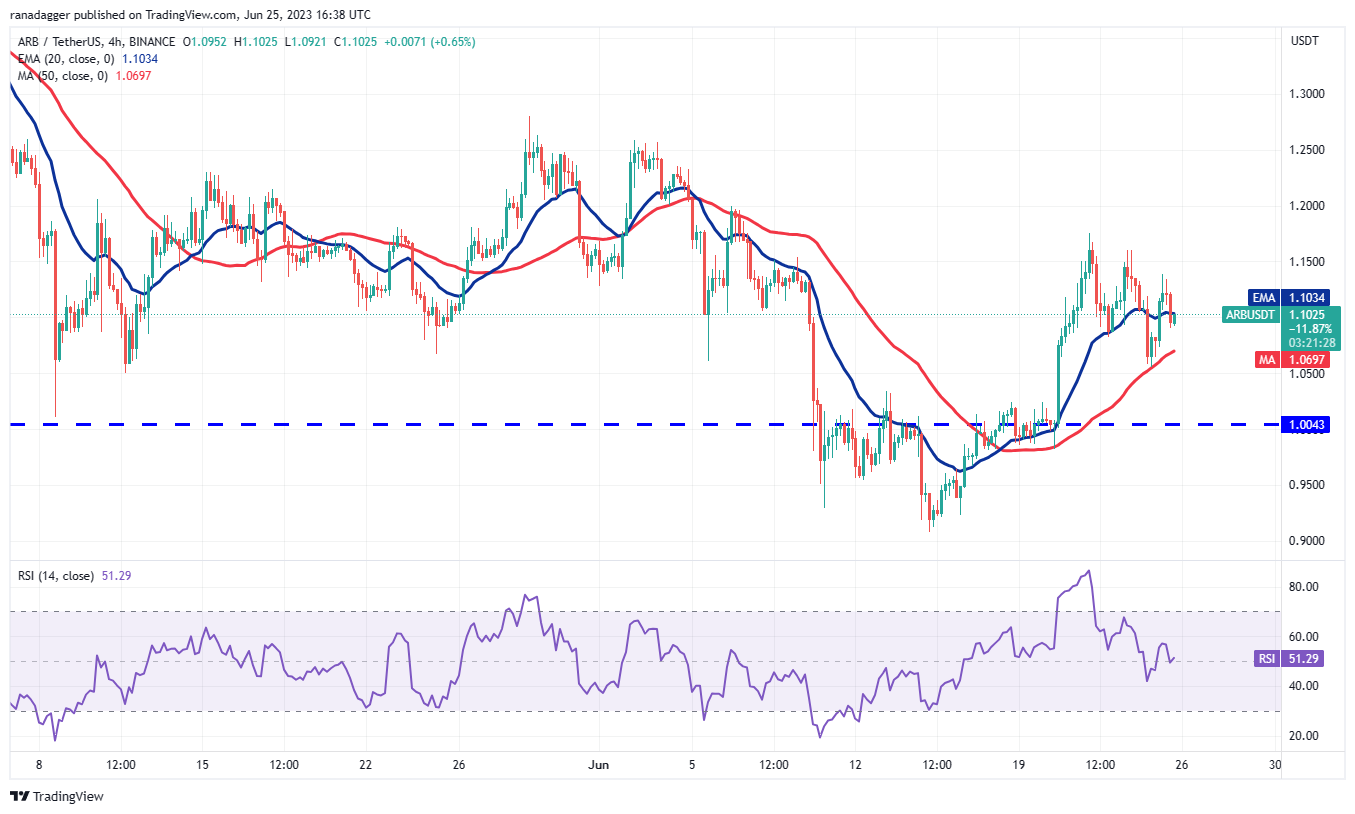
The 4-hour chart shows that the bulls are struggling to overcome the obstacle at $1.18. This indicates that bears are active at higher levels. Sellers pulled the price below the 20-EMA but they could not crack the 50-SMA.
The 20-EMA is flattening out and the RSI is near the midpoint, indicating a balance between buyers and sellers. If bulls drive the price above $1.18, it will indicate the start of a strong recovery. Contrarily, a break and close below the 50-SMA may result in a slump to $1.
Related: Bitcoin sees new all-time highs in 3 countries as BTC price pokes $31K
VeChain price analysis
VeChain (VET) turned down from the resistance line on June 23 but the bears are struggling to sustain the price below the 50-day SMA ($0.018). This suggests that traders are buying the dips.
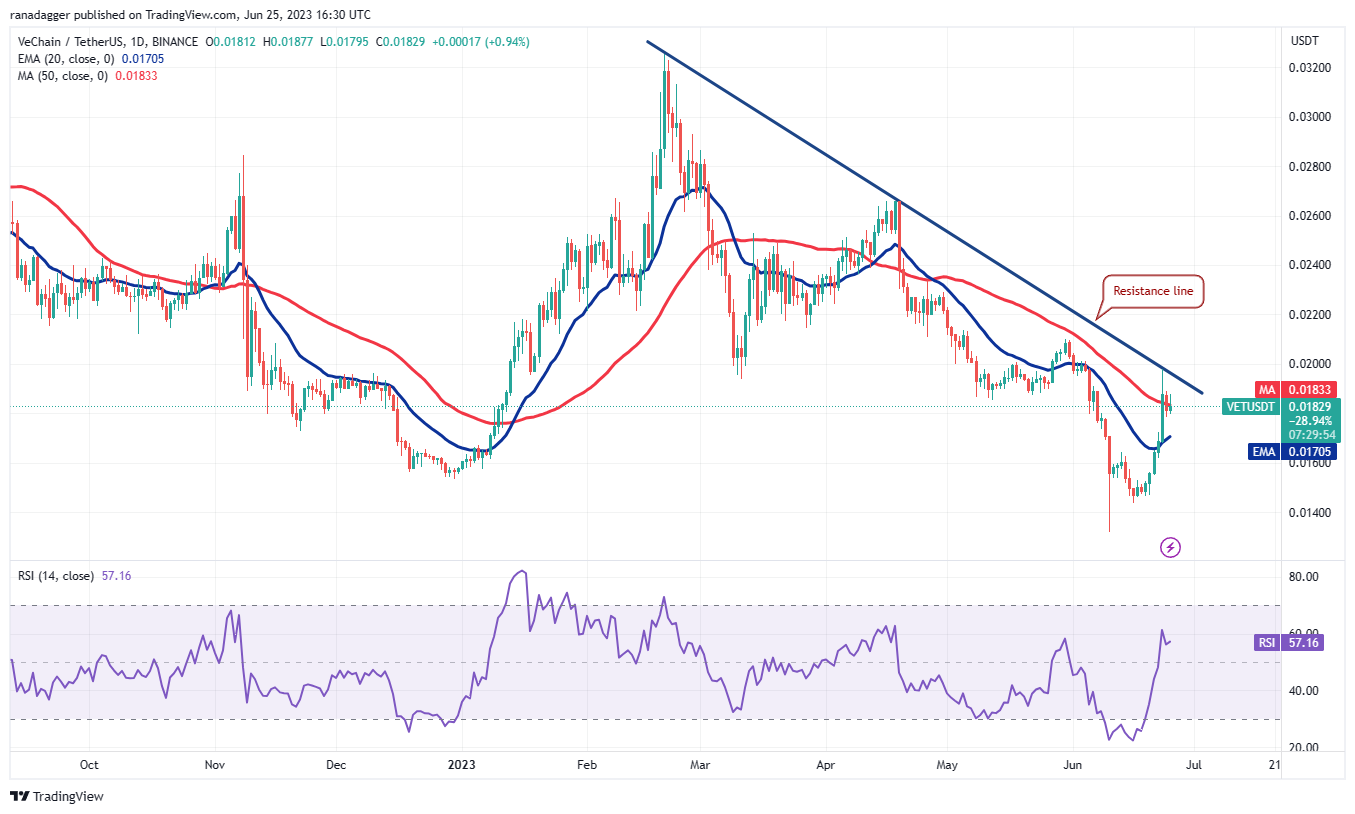
The bulls will once again try to propel the price above the resistance line. If they succeed, it will indicate that the downtrend has ended. The VET/USDT pair could then start its upward move toward $0.026.
Contrary to this assumption, if the price once again turns down from the resistance line, it will suggest that the bears remain in control. They will then try to sink the pair below the moving averages and challenge the support at $0.013.
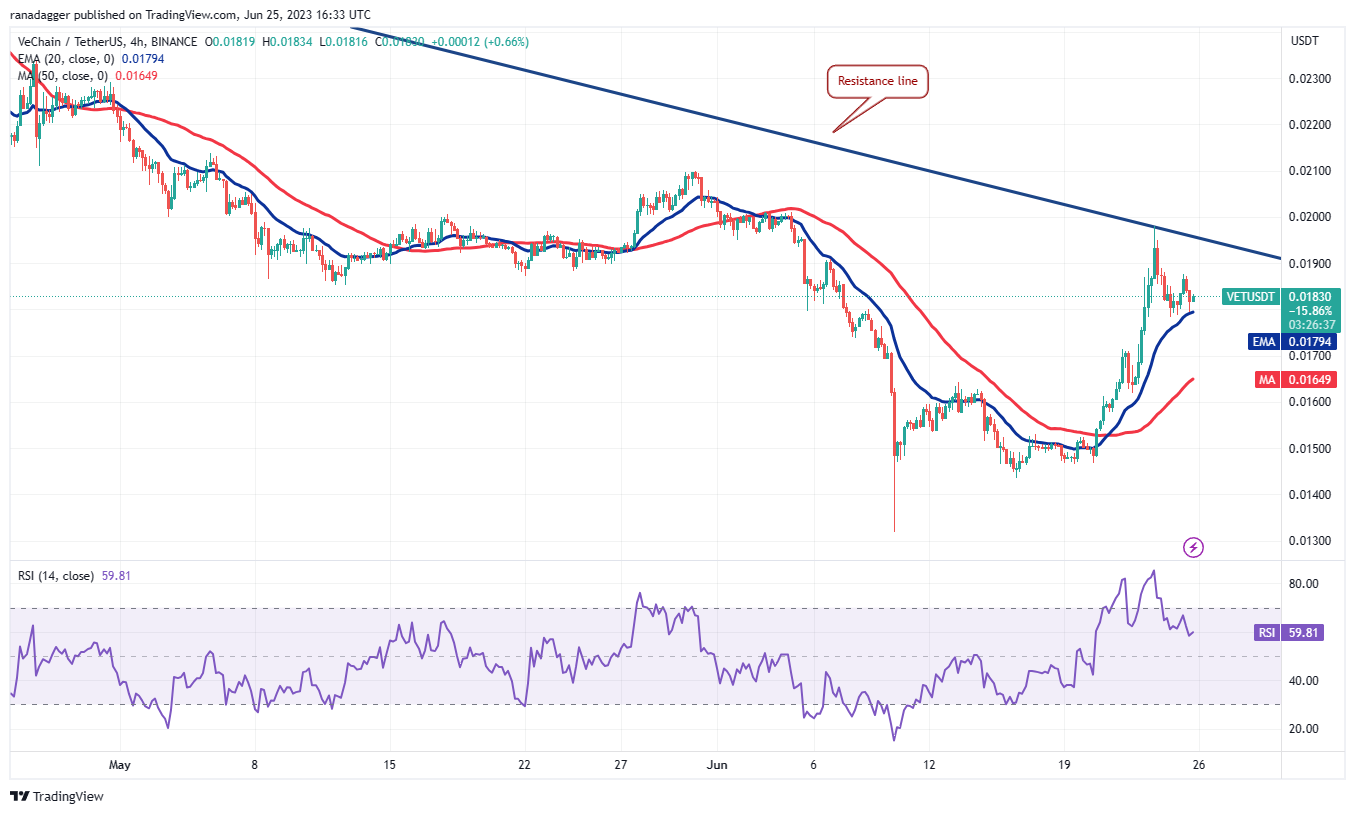
The 4-hour chart shows that the price reversed direction from the resistance line but is finding support at the 20-EMA. This suggests that the sentiment is turning positive and traders are viewing the dips as a buying opportunity.
The bulls will again attempt to propel the price above the resistance line. If they manage to do that, the pair could climb to $0.021. This level may again act as a hurdle but if crossed, the up-move may begin. The first support on the downside is the 20-EMA and next is the 50-SMA.
Stacks price analysis
Stacks (STX) soared above the moving averages on June 20, signaling a potential trend change. The corrective phase started on June 22 but a positive sign is that the price remains above the moving averages.
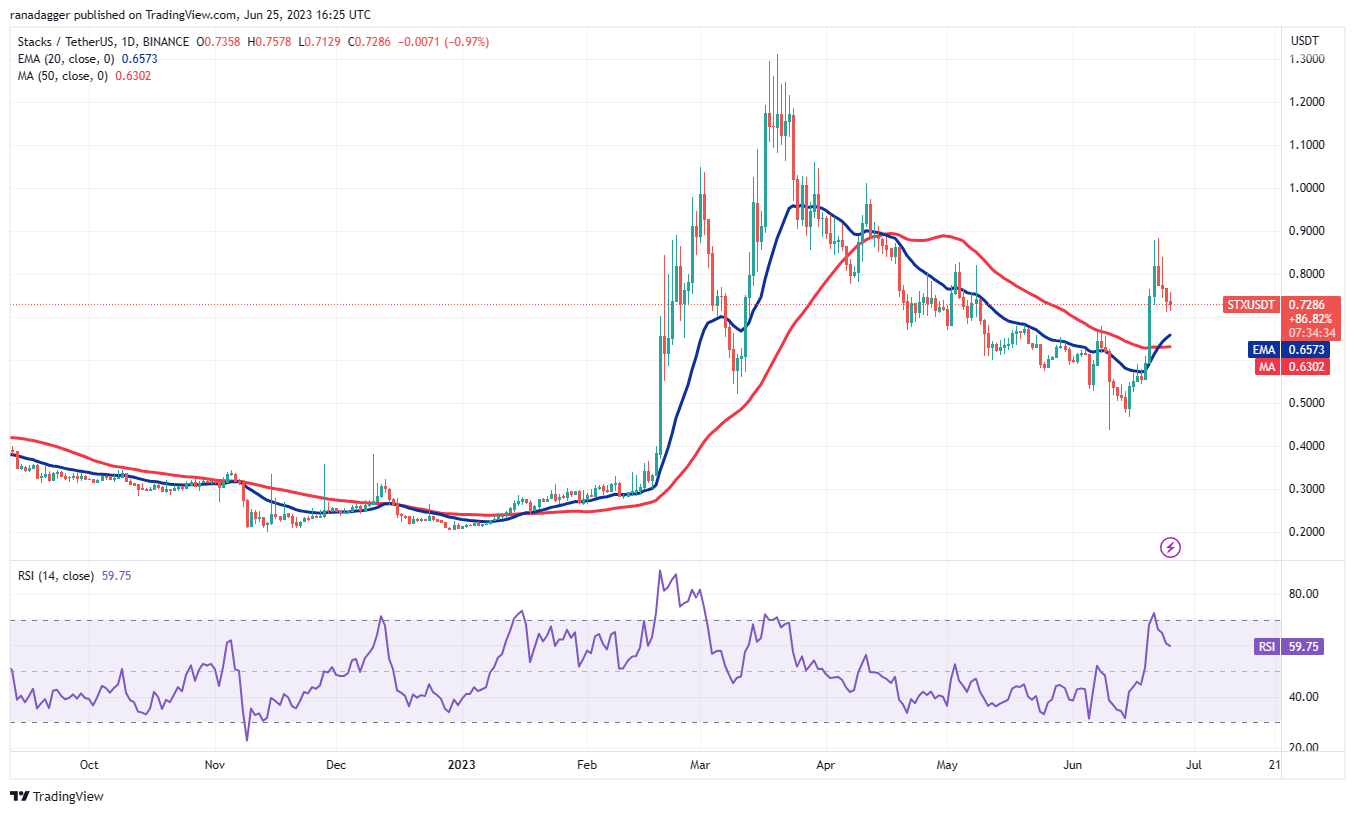
The moving averages have completed a bullish crossover and the RSI is in positive territory, indicating that bulls have the upper hand. If the price turns up from the current level or rebounds off the 20-day EMA ($0.65), it will suggest buying on dips. That will enhance the prospects of a break above $0.89.
If that happens, the STX/USDT pair could rally to $1.10 and thereafter to $1.30. This positive view will be invalidated if the price turns lower and plummets below the moving averages. Such a move will suggest that the bears have not yet given up and they continue to sell on rallies.
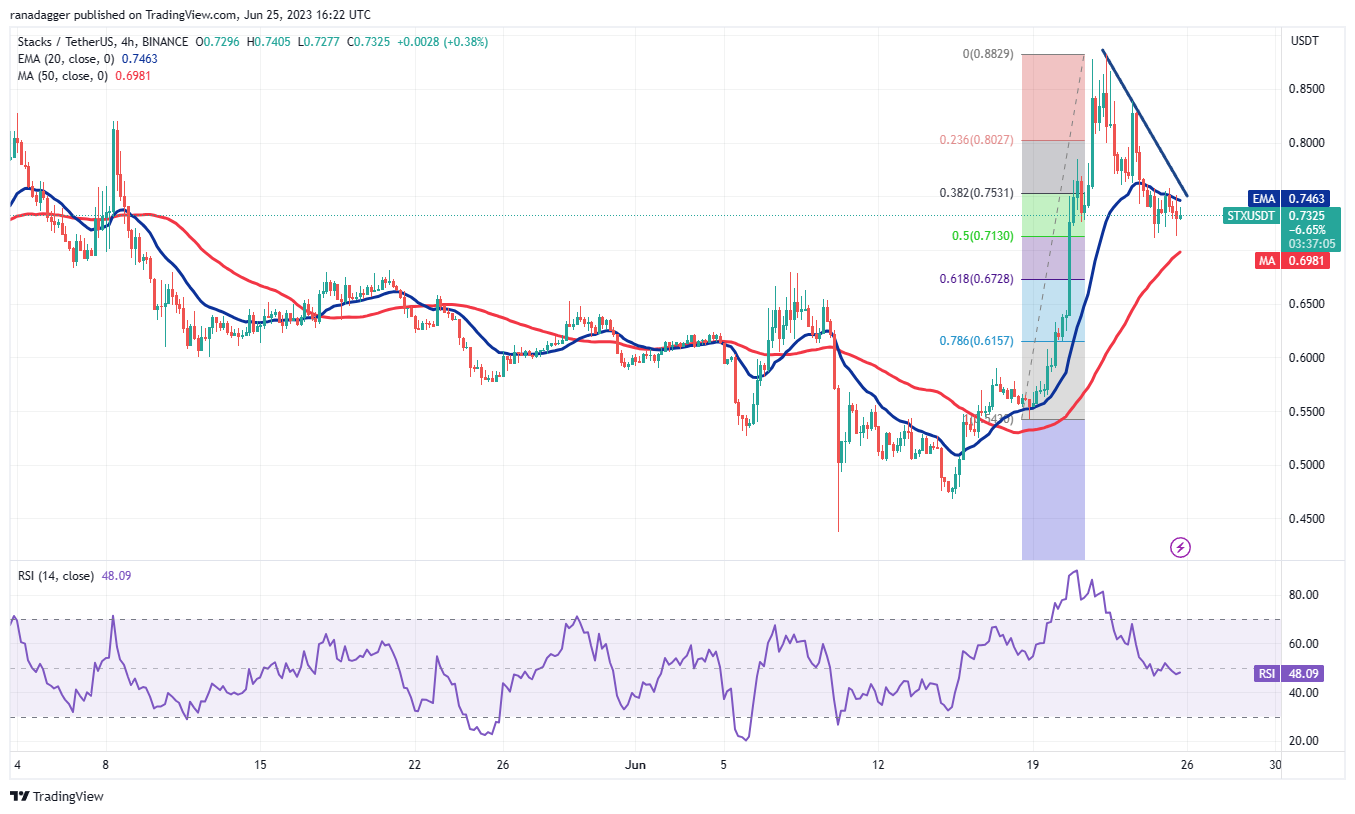
The 4-hour chart shows that the pair is in a corrective phase. The bears pulled the price below the 20-EMA but the bulls are defending the 50% Fibonacci retracement level of $0.71. Buyers will have to drive the price above the downtrend line to open the doors for a possible rally to $0.88.
Alternatively, if the price turns down from the downtrend line, it will suggest that bears are trying to gain the upper hand. A break and close below the 61.8% retracement level of $0.67 could indicate that the bears are back in the game.
This article does not contain investment advice or recommendations. Every investment and trading move involves risk, and readers should conduct their own research when making a decision.
This article is for general information purposes and is not intended to be and should not be taken as legal or investment advice. The views, thoughts, and opinions expressed here are the author’s alone and do not necessarily reflect or represent the views and opinions of Cointelegraph.


