
Bitcoin has observed a surge towards the $26,700 level in the past day. Here’s what on-chain data says regarding whether this rise would stay.
Bitcoin Has Broken The $26,700 Level During The Past Day
After a long run of stagnation around and below the $26,000 level, Bitcoin finally seems to be making a steady run above it, as the cryptocurrency has now breached the $26,700 mark.

Looks like BTC has observed an increase over the past few days | Source: BTCUSD on TradingView
With this latest rise, BTC is up about 4% during the past week, making the coin the best performer among the top 10 assets by market cap in the sector. After seeing so many fragile attempts at recovery in recent weeks, though, Bitcoin investors might be doubtful whether this rise is here to stay.
On-chain data might provide some hints about this. First, here are how the support and resistance levels look like from an on-chain perspective, according to data from the market intelligence platform IntoTheBlock:
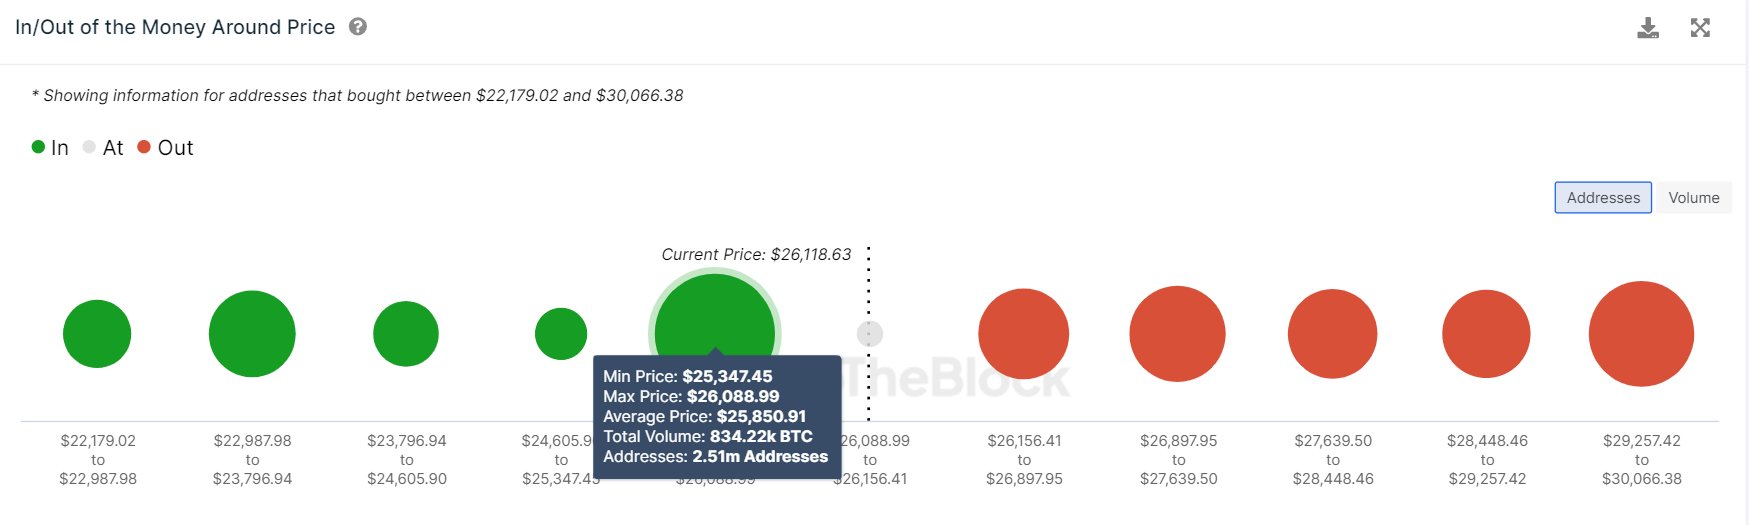
The concentration of holders at the different price levels | Source: IntoTheBlock
Generally, investors tend to buy more at their cost basis (the price at which they bought their coins) whenever the price dips back to their cost basis from above.
As they had been in profits before this dip, they may believe that the price would rise shortly and that their cost basis could be a profitable entry point for further accumulation.
On the other hand, investors in loss might look forward to the price reaching their cost basis to sell and exit. This can provide resistance to the asset if many investors have the same cost basis as the price it’s trying to test from below.
In the above infographic, the various price levels and the investor concentrations at them are displayed. When IntoTheBlock posted it, the price had been trading at $26,100.
The cryptocurrency is currently mowing through the $26,100 to $26,900 range, which holds the cost basis of a decent amount of investors. Should the asset’s attempts fail, though, the $25,300 to $26,100 range should provide plenty of support, as it currently has a thick concentration of holders.
Bitcoin Exchange Inflows Have Occurred Throughout The Last Month
However, one sign that may be concerning for the asset is that the whales have been making significant deposits to exchanges during the past month, as analyst James V. Straten has pointed out.
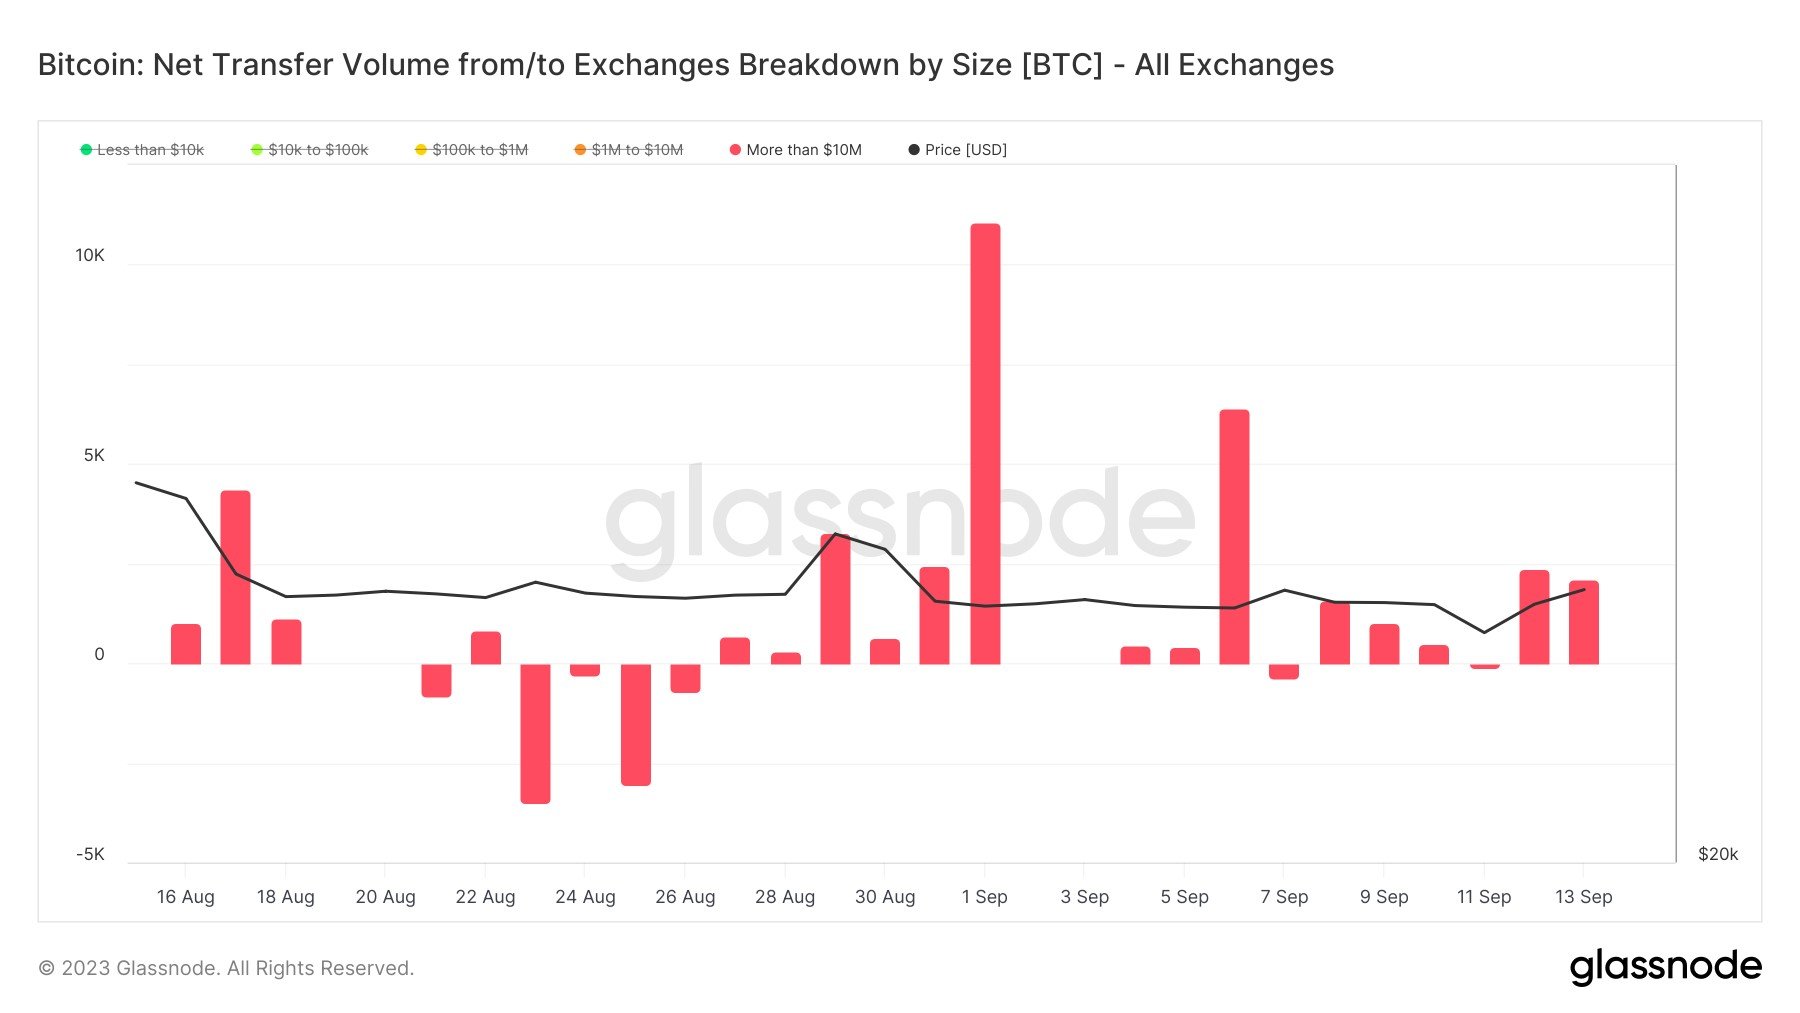
The value of the metric seems to have been above zero for most of this period | Source: @jimmyvs24 on X
The above chart shows the data for the Bitcoin exchange netflows only for transfers worth at least $10 million. This graph shows that the metric has mostly had a positive value throughout the past month, meaning that large entities like the whales have been constantly moving coins into these platforms.
As one of the main reasons these investors may transfer to exchanges is for selling purposes, this could indicate that these holders have been preparing for a selloff.
It remains to be seen whether these Bitcoin whale exchange inflows would lead to this short-lived rise or if the market would bash through the selling pressure.
Featured image from Kanchanara on Unsplash.com, charts from TradingView.com, Glassnode.com


