
Bitcoin has broken back above the $27,000 level during the past day, but if on-chain data is to go by, this surge may not last for long.
Bitcoin Investors Are Taking Profits At Highest Rate In 3 Months
According to data from the on-chain analytics firm Santiment, there is a chance that a short-term correction could happen for the cryptocurrency. The relevant metric here is the “ratio of daily on-chain transaction volume in profit to loss,” which, as its name suggests, tells us about how the profit-taking volume compares against the loss-taking volume on the Bitcoin network right now.
This indicator works by going through the transaction history of each coin being sold/transferred on the blockchain to see what price it was moved at before. If this previous selling price for any coin was less than the current spot price, then that coin is being sold at a profit right now.
The sale of all such tokens would contribute toward the Bitcoin profit-taking volume, while coins of the opposite type would add towards the loss-taking volume.
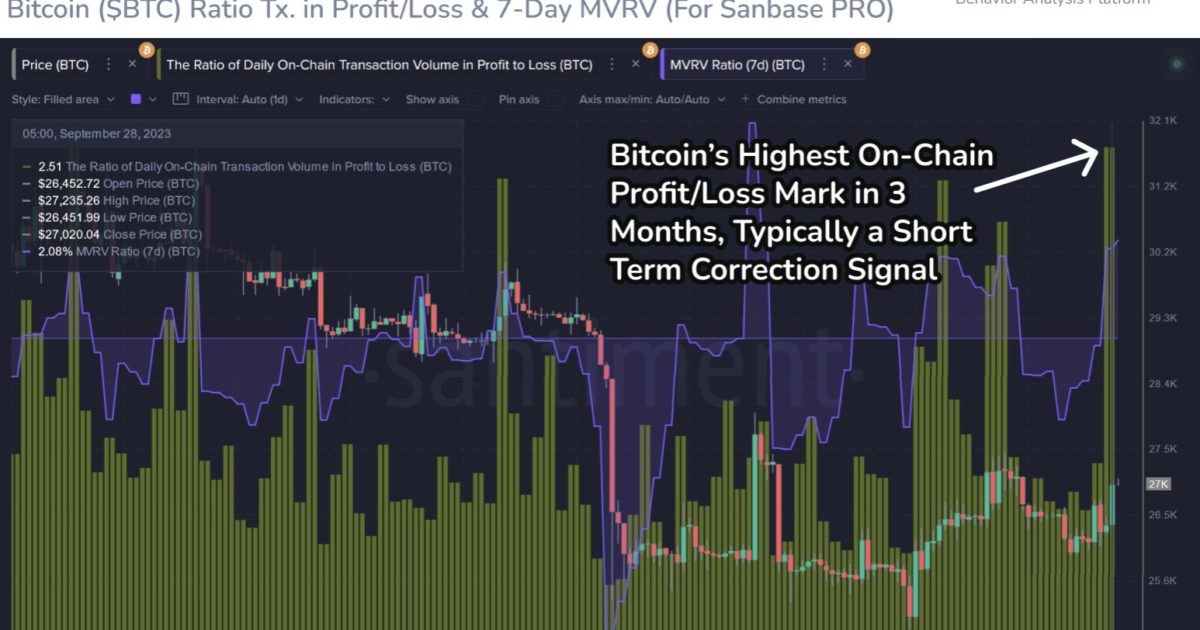
Now, here is a chart that shows the trend in this BTC metric over the past few months:
The value of the metric seems to have been quite high in recent days | Source: Santiment on X
As displayed in the above graph, this Bitcoin indicator has observed a large spike as the cryptocurrency’s price itself has seen a surge beyond the $27,000 mark and has reached a value of 2.51.
When the metric has a value greater than zero, it means that the profit-taking volume is more than the loss-taking volume. On the other hand, values under this threshold suggest the dominance of loss-taking.
At the current value of 2.51, the profit-taking volume outweighs the loss-taking one by 3.51 to 1. This disparity between these two volumes is the highest it has been since around three months ago.
Historically, intense profit-taking has usually resulted in at least a short-term top for Bitcoin, so it’s possible that the current values of the metric would also result in a correction for the price.
In the chart, Santiment has also attached the data for the “Market Value to Realized Value (MVRV) ratio,” which keeps track of the difference between the Bitcoin market cap and realized cap.
The latter of these is basically a measure of the total amount of capital that the investors as a whole have put into the cryptocurrency, so this metric tells us how the value that the holders are carrying currently compares with their total investment.
From the graph, it’s visible that the 7-day Bitcoin MVRV ratio has turned notably positive with this rise, which implies that the investors are carrying profits at the moment.
The analytics firm notes that this metric going back below zero would be ideal for the next leg up, as the holders being in loss would lead to an exhaustion of the profit-sellers.
BTC Price
So far, despite the aggressive profit-taking happening in the market, Bitcoin has managed to hold above the $27,000 mark.

BTC has observed a strong surge in the past day | Source: BTCUSD on TradingView
Featured image from Shutterstock.com, charts from TradingView.com, Santiment.net


