

Since our last market update, Bitcoin has continued to plunge lower.
The leading cryptocurrency just minutes ago tapped $8,180 for the third time in the past two days. BTC has since bounced off that level, indicating that this level is of some importance, rallying back to $8,450 as of the time of this article’s writing.
Bitcoin price chart from TradingView.com
The initial sell-off from Monday’s highs of $9,200 to $8,500 resulted in $20 million worth of liquidations. This latest leg lower from $8,500 to $8,100 catalyzed another $15 million worth of long positions liquidations on BitMEX, according to data from Skew.com.
As to what is causing the ongoing drop, analysts are divided.
One trader proposed that it was a “coordinated” sell-off by miners, but data from blockchain intelligence firm ByteTree suggests that this is not the case. Instead, with funding rates crashing through the floor, this could be a concerted attempt by shorts to bring the price lower.
Joe McCann, an AI and cloud specialist at Microsoft and a noted crypto trader, commented in his Telegram channel on the drop:
“Lowest [funding rate] print on this flush about half of the previous…fewer longs to liquidate. That’s why I think it could be a short term capitulation bottom.”
Bitcoin Holds Key Levels
Although the drops are not a bullish sign for Bitcoin, it is important to note that the bouts of bearish action over the past two days have all stopped in one key region: $8,000 to $8,200.
This is important for bulls, as analysts have explained, because this is the point at which there lie the 100-day and 200-day simple moving averages. These levels are seen as technical inflection points for markets, crypto included.
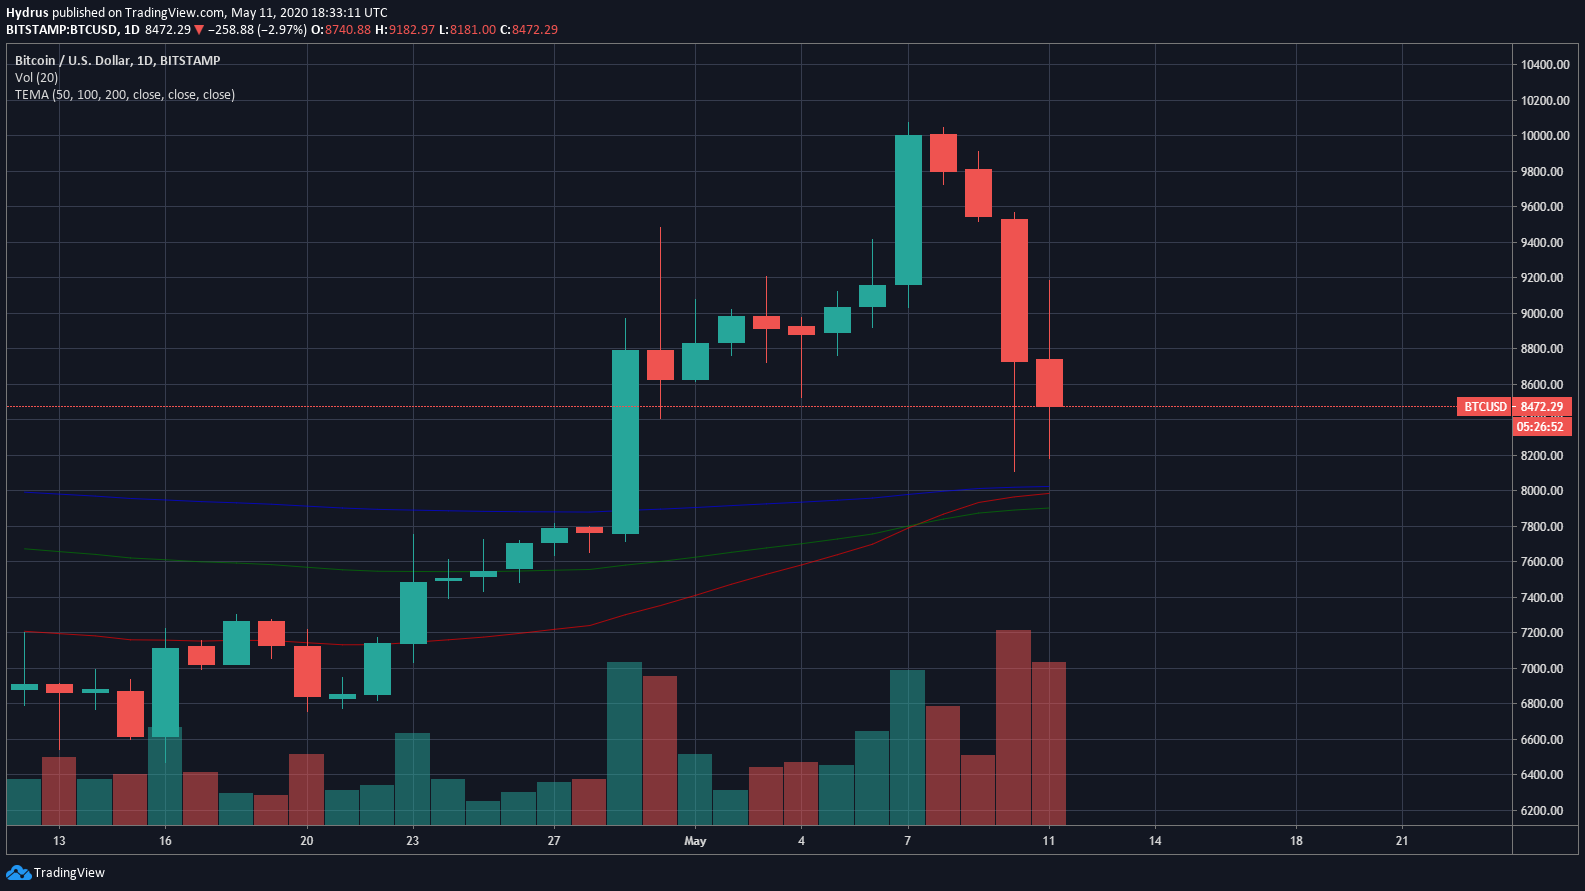
Bitcoin price chart with key moving averages from TradingView.com
$8,000-8,200 is also a range at which there is a confluence of historical trendlines and a horizontal resistance, further adding credence to the bullish sentiment.
Analysts Remain Optimistic
Analysts are largely optimistic about Bitcoin moving forward from a short to medium-term perspective, this drop aside.
One popular trader shared the chart below, indicating that there are remarkable similarities between Bitcoin’s price action for all of 2020 and that of the past three days: both periods have a four-phase distribution top, a capitulation crash, then a rapid recovery from the lows.
The fractal playing out in full, the trader suggested, will result in BTC returning to $10,000 in the coming two to three days.
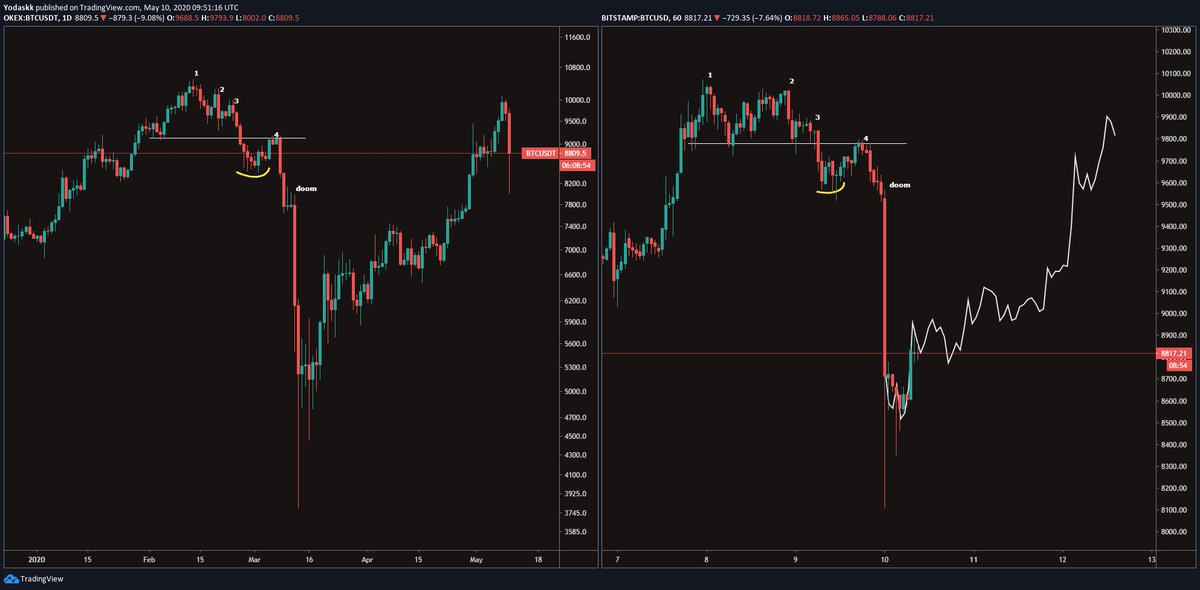
Chart from @Yodaskk (Twitter handle), a popular crypto trader
Photo by Harley-Davidson on Unsplash


