

Bitcoin price is up over 8% and trading above the $67,500 resistance. BTC is eyeing a new all-time high and could even hit the $70,000 level.
- Bitcoin price is moving higher above the $66,500 support zone.
- The price is trading above $67,500 and the 100 hourly Simple moving average.
- There is a connecting bullish trend line forming with support at $66,000 on the hourly chart of the BTC/USD pair (data feed from Kraken).
- The pair could accelerate higher toward the $69,200 resistance or even $70,000.
Bitcoin Price Rallies Again
Bitcoin price remained well-bid above the $65,000 support zone. A new support base was formed, and the price started another rally above the $66,000 level. There was a steady increase toward the $67,500 level.
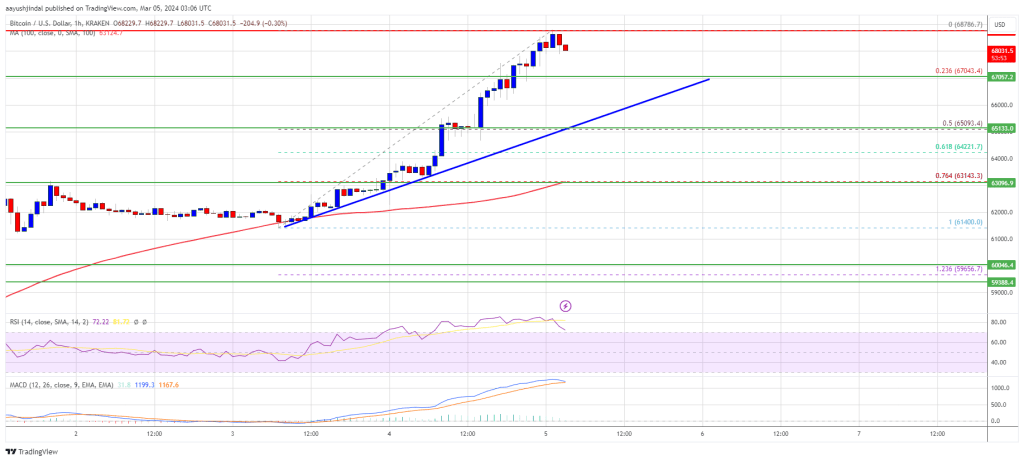
The price is up over 8% and it traded close to the last all-time high. A high is formed at $68,786 and the price is now consolidating gains above the 23.6% Fib retracement level of the upward move from the $61,400 swing low to the $68,786 high.
Bitcoin is now trading above $67,500 and the 100 hourly Simple moving average. There is also a connecting bullish trend line forming with support at $66,000 on the hourly chart of the BTC/USD pair.
Source: BTCUSD on TradingView.com
Immediate resistance is near the $68,800 level. The next key resistance could be $69,200, above which the price could rise toward the $70,000 resistance zone. If there is a clear move above the $70,000 resistance zone, the price could rise toward the $71,200 level. Any more gains might send the price toward the $75,000 level.
Downside Correction In BTC?
If Bitcoin fails to rise above the $68,800 resistance zone, it could start another downside correction. Immediate support on the downside is near the $67,000 level.
The first major support is $66,000 or the trend line. If there is a close below $66,000, the price could start a decent pullback toward the 50% Fib retracement level of the upward move from the $61,400 swing low to the $68,786 high or $65,000. Any more losses might send the price toward the $63,200 support zone.
Technical indicators:
Hourly MACD – The MACD is now gaining pace in the bullish zone.
Hourly RSI (Relative Strength Index) – The RSI for BTC/USD is now above the 50 level.
Major Support Levels – $67,000, followed by $66,000.
Major Resistance Levels – $68,800, $69,200, and $70,000.
Disclaimer: The article is provided for educational purposes only. It does not represent the opinions of NewsBTC on whether to buy, sell or hold any investments and naturally investing carries risks. You are advised to conduct your own research before making any investment decisions. Use information provided on this website entirely at your own risk.


