

Bitcoin price restarted its increase from the $34,650 support. BTC is up over 5% and now attempting a move above the $38,000 resistance zone.
- Bitcoin started a fresh rally from the $34,650 support zone.
- The price is trading above $36,500 and the 100 hourly Simple moving average.
- There was a break above a major bearish trend line with resistance near $36,300 on the hourly chart of the BTC/USD pair (data feed from Kraken).
- The pair could continue to move up if it clears the $38,000 resistance zone.
Bitcoin Price Trims All Losses
Bitcoin price started a downside correction from the $38,000 resistance. BTC declined below the $36,000 and $35,500 levels. The price even spiked below $35,000. However, the bulls were active near the $34,650 support zone.
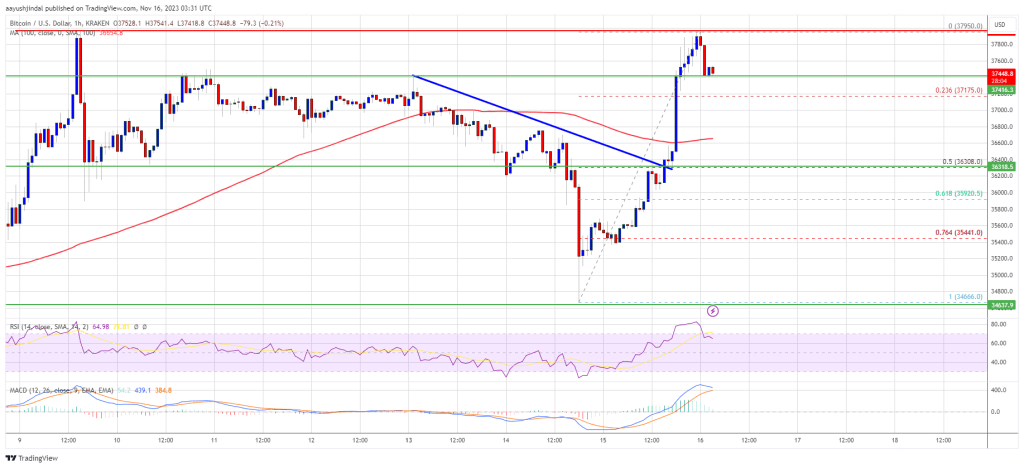
A low was formed near $34,666 and the price started a fresh increase. There was a sharp increase above the $36,000 and $37,000 levels. There was also a break above a major bearish trend line with resistance near $36,300 on the hourly chart of the BTC/USD pair.
Bitcoin price is up over 5% and it retested the $38,000 resistance zone. A high is formed near $37,950 and the price is now consolidating gains. It is also trading above $36,500 and the 100 hourly Simple moving average and the 23.6% Fib retracement level of the upward move from the $34,666 swing low to the $37,950 high.
On the upside, immediate resistance is near the $37,850 level. The next key resistance could be near $38,000 or the recent high. A close above the $38,000 resistance could start a strong increase.
Source: BTCUSD on TradingView.com
The first major resistance is near $38,800, above which the price might accelerate further higher. In the stated case, it could test the $39,200 level. Any more gains might send BTC toward the $40,000 level.
More Losses In BTC?
If Bitcoin fails to rise above the $38,000 resistance zone, it could start another downside correction. Immediate support on the downside is near the $37,450 level.
The next major support is $36,500 or the 100 hourly Simple moving average. If there is a move below $36,500, there is a risk of more downsides. In the stated case, the price could drop toward the $35,850 support in the near term.
Technical indicators:
Hourly MACD – The MACD is now losing pace in the bullish zone.
Hourly RSI (Relative Strength Index) – The RSI for BTC/USD is now above the 60 level.
Major Support Levels – $37,450, followed by $36,500.
Major Resistance Levels – $37,850, $38,000, and $38,800.


