Bitcoin Price Hovering Round $10K, But Could Rally Again
August 19, 2019 by Ramiro Burgos
Seriously, what’s the deal with the bitcoin price? At the moment it’s hovering sideways around the $10,000 USD mark even while indicators weaken. But as our weekly technical analysis shows, this could prompt another bullish rally if external factors align on time. Read on to find out more.
Also read: Technical Analysis: Bitcoin Price ‘Shows Muscle’
Subscribe to the Bitsonline YouTube channel for great videos featuring industry insiders & experts
Bitcoin Price Technical Analysis
Long-Term Analysis
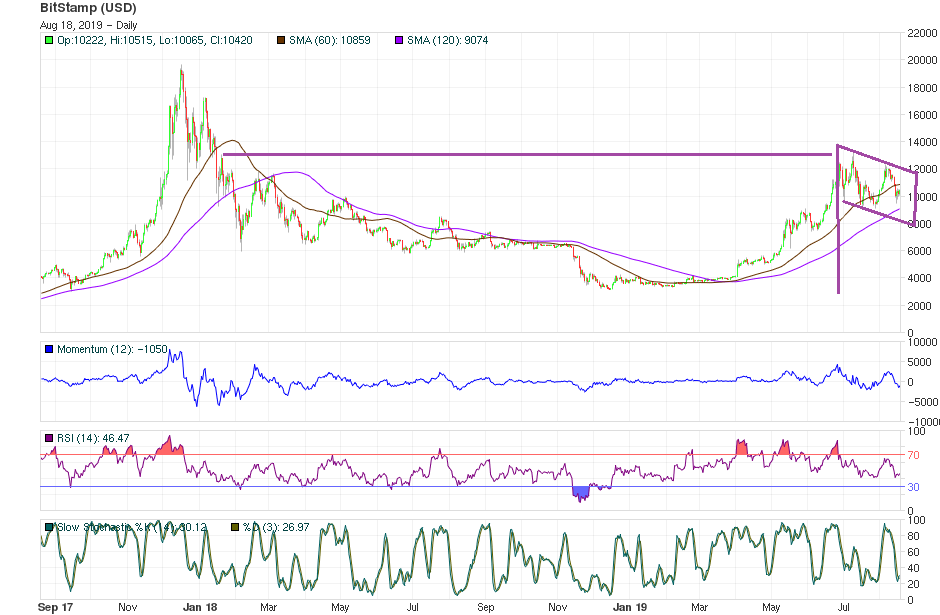
The bitcoin price still shows increasing volatility, which reflects a pre-bullish long term rally scenario. If this confirms, it could recognize a resistance at the $12,000 level and a support near $9,000. Even if the action moves only between this 3,000 basis point stage, our Hope phase from Mass Psychology Analysis seems be safe — and depending on external factors may give way to Optimism, if and when values overcome $12,000.
Bullish consensus plays a main role in favoring a chance to transfer the above-mentioned 3,000 points up to $14,000. On the other hand, if same external stimuli get cancelled or arrive late generating confusion, the current distribution pattern could melt the trend down to $6,000 in case the $9,000 support level gets broken.
Mid-Term Analysis
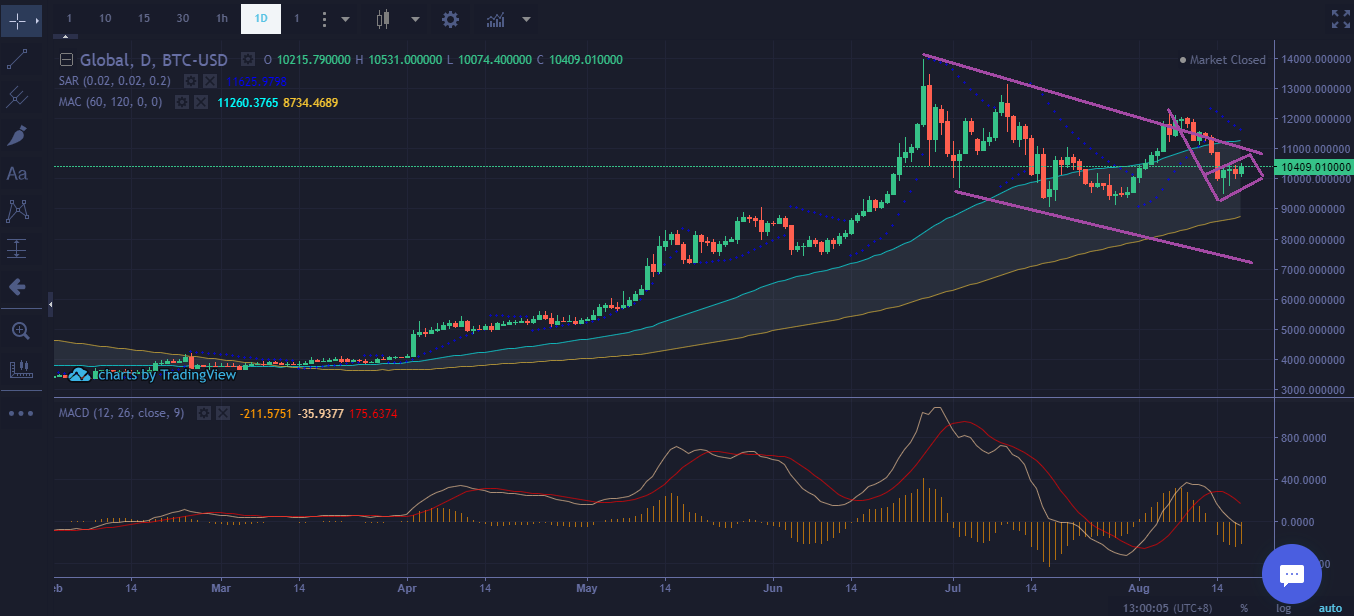
Mathematical Indicators are heading strongly down, while quotes continue to reinforce the lateral development structure between $9,000 and $12,000. There’s drifting high volatility action which is spreading the general will, displaying confusing signals of activation and cancelation of instant targets — up to $14,000, or down to $6,000.
A small Inverted Flag formation has appeared inside the current bearish channel, which could contribute to drive the action to a $9,000 support, before the bullish trend recovers the way back up in the background frame and rebounds.
Short-Term Analysis
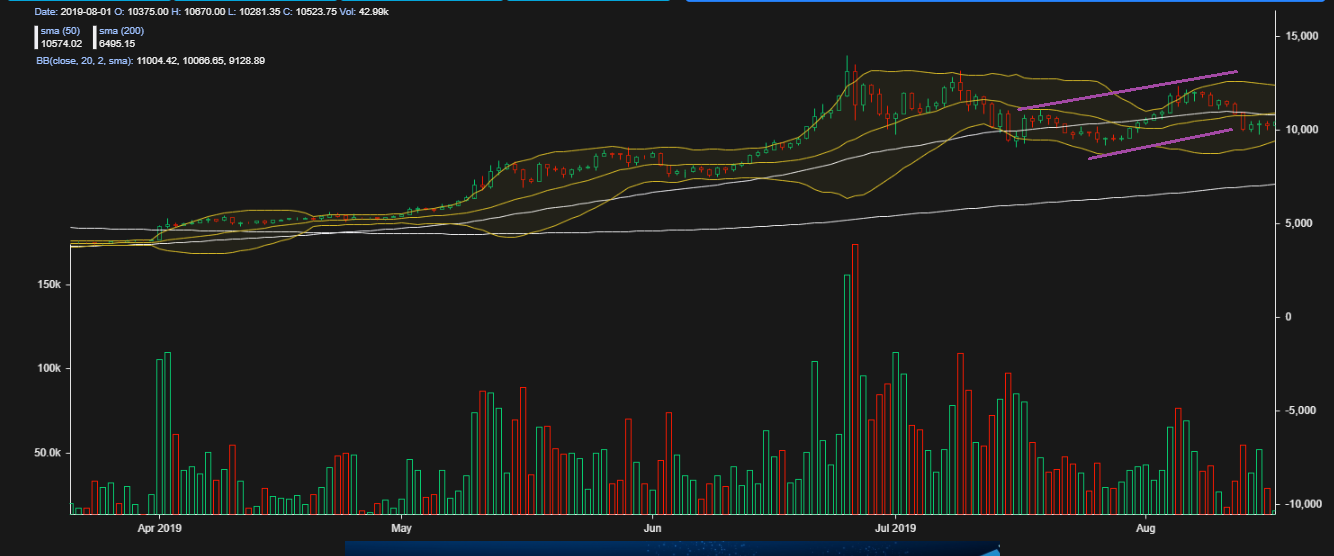
Mixing several criteria, we find that Elliott Wave Theory’s cycle is over and values could be ready for a mayor movement. Bollinger Bands Analysis shows prices crossing the centerline to stay in the lower band. Japanese Candlestick Analysis’ imaginary examples suggest Demand Soldiers are ordering themselves in a strong enough formation to balance current selling pressure and start a solid upward advance, to conquer the intermediate $12,000 resistance (which is still controlled by the distribution power of Offer’s Crows.
If Offering prevails in this distribution action, as has happened since early July 2019 and continues so far in the preent lateral market, all the activity should shift down to get locked for another two months at a lower level between $9,000 and $7,000.
What do you think will happen to the bitcoin price? Share your predictions in the comments below.
If you find Ramiro’s analyses interesting or helpful, you can find out more about how he comes to his conclusions by checking out his primer book, the Manual de Análisis Técnico Aplicado a los Mercados Bursátiles. The text covers the whole range of technical analysis concepts, from introductory to advanced and everything in between. To order, send an email to [email protected]
Images via Pixabay, Ramiro Burgos
This technical analysis is meant for informational purposes only. Bitsonline is not responsible for any gains or losses incurred while trading bitcoin.


