

Bitcoin price over the last 24 hours saw an over $3,000 crash and more than 15% wiped out from its price tag.
Despite the downside, the cryptocurrency is undeniably in a bull market. But bull markets do correct, and when they do it can be powerful. As to where Bitcoin could fall to, the last bull market and one particular indicator could provide clues.
Bitcoin Begins First Major Bull Market Correction Since $10,000 Breakout
The leading cryptocurrency by market cap shocked Wall Street and the rest of the world over the last few months. The asset has broken nearly every record related to it but fell just shy of breaking its all-time high before a strong correction began.
Technical indicators such as the RSI on daily timeframes have reached the longest period of oversold conditions ever, and on weekly timeframe has surged into bull market territory. Still, when an asset trends this hard, the corrections are just as severe.
Related Reading | Bitcoin Rally Isn’t Just Institutional Driven, Emerging Markets Are Voting For Revolution
Yesterday, the cryptocurrency set a high of $19,500. As of this morning, a low of $16,100 was reached wiping out more than $3000 of the asset’s previously increasing price tag.
The momentum has only just shifted, and given the strength of the move up, the correction is likely to be as dramatic. And with bulls now conditioned to buy every dip, the potential for a squeeze of the last remaining leveraged traders before the next leg up is high.
Given all the conditions, it is time to pay attention.
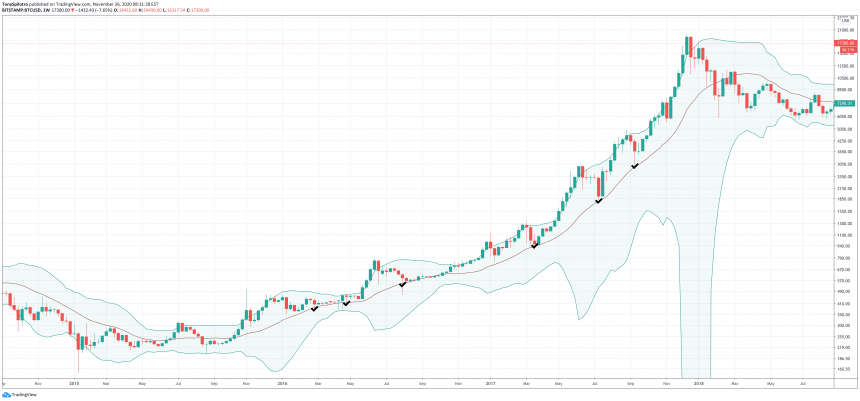
The middle-BB acted as bull market support the entire way up | Source: BTCUSD on TradingView.com
Bull Market Corrections Fall To Middle-Line On Bollinger Bands: Target Is $12,400
The quote is a nod to a commonly used phrase by Bollinger Bands creator John Bollinger. The technical indicator he created was used to spot the powerful Bitcoin movement upward before it fully began.
The structure is looking good, but we need a bit of confirmation first. One set of tactics might be a start a position here and add to as it works out with an initial stop under the 9/23 low.
— John Bollinger (@bbands) October 5, 2020
The tool is a complex one with a moving average and two standard deviations that diverge or contract measuring volatility. Bollinger Bands are most famous for their “squeeze” and ability to predict major breakouts – precisely what happened prior to this bullish impulse move.
But Bollinger Bands can also be used to find support or resistance, and in Bitcoin bull markets, the middle-line appears to be the de facto support level that keeps the uptrend intact.
If bulls want to be successful and knife catch the exact bottom of the correction, then the middle-BB on weekly timeframes is an area to watch.
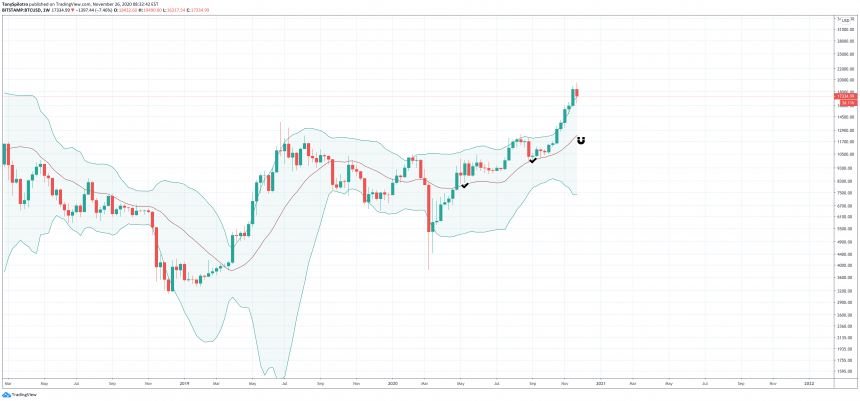
The middle-line moving average on the Bollinger Bands could be the correction target | Source: BTCUSD on TradingView.com
Currently, on weekly timeframes, the middle-line is currently around $12,400 which would result in a roughly 37% correction. Data also shows that during the last bull market, historically, the top cryptocurrency crashed on average 37%.
Related Reading | Search Engine Marketing Data Reveals Highest Retail Interest In Bitcoin Ever
With the all-important middle-BB lining up almost exactly with that steep of a correction, it is most certainly time to pay attention.
Featured image from Deposit Photos, Charts from TradingView.com


