

Bitcoin Price Finally Moves, but Not How You Wanted. What’s Next?
October 7, 2019 by Ramiro Burgos
After all those months hovering around $10,000 USD, this probably isn’t what holders wanted. Affected by external factors, the bitcoin price downgraded from its higher lateral market to the $8,000 level, activating a reversal target near $11,000. Read our weekly technical analysis for the deeper details.
Also read: Bitcoin Price Sitting Still at $10K – What Could Make It Move?
Bitcoin Price Technical Analysis
Long-Term Analysis
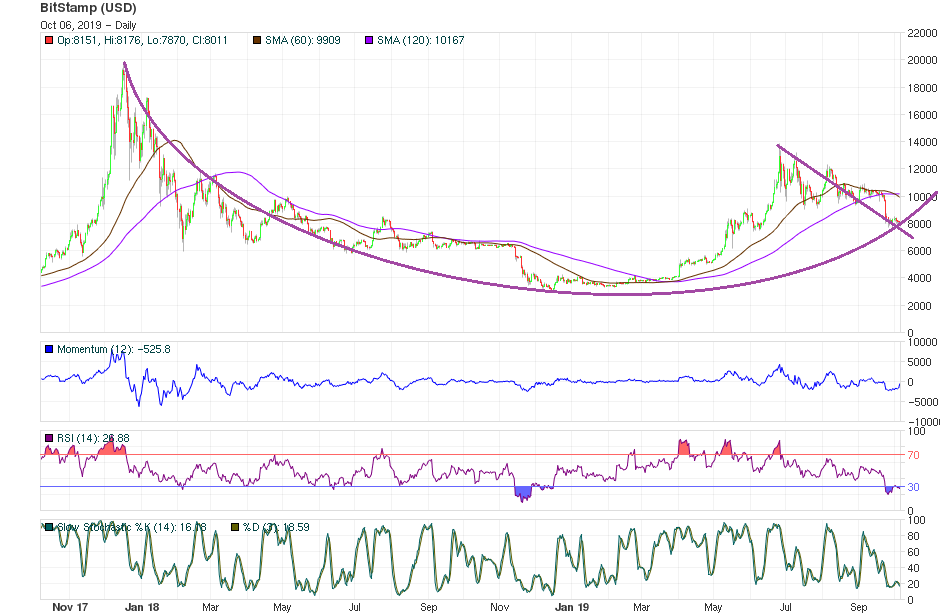
Sensitive to News and external factors, the bitcoin price dropped to a rounded bottom long-term formation curve mark near $7,500. It re-balanced at the $8,000 level, staying out of further crack danger by keeping the lateral market active.
External factors and News also increased volatility, expanding the former 3,000 basis point swinging range to 4,000, and activating a bullish target near $11,000. This target is backed by a bullish consensus, with a psychological trigger if and when quotes overcome the recent $9,000 broken support.
Mid-Term Analysis
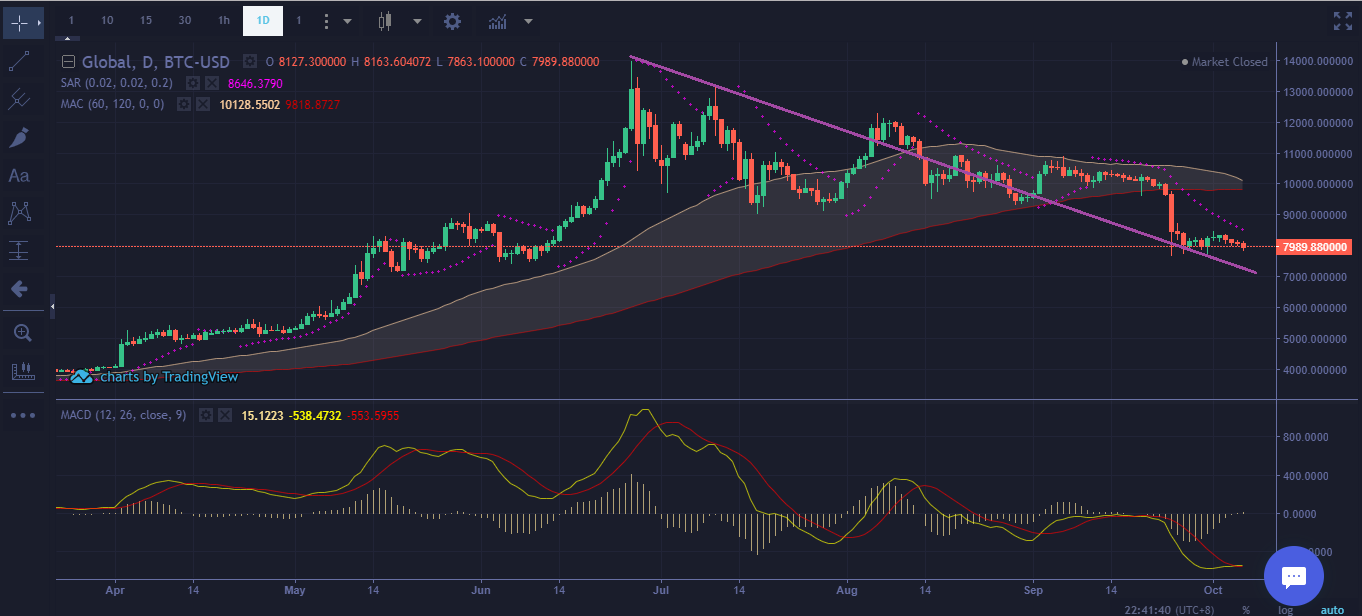
When values dropped to $7,500, the trendline synchronized with their mathematical indicators. That trendline then fell to the upper bound of the bearish channel it recently left behind by the last lateral movement.
If prices bounce at this point, volatility could boost a V-bottom symmetric reaction back to $11,000, balancing itself back around the $10,000 axis. On the other hand, if prices stay below $9,000, we could re-consider a support level at $6,000 as a new scenario.
Short-Term Analysis
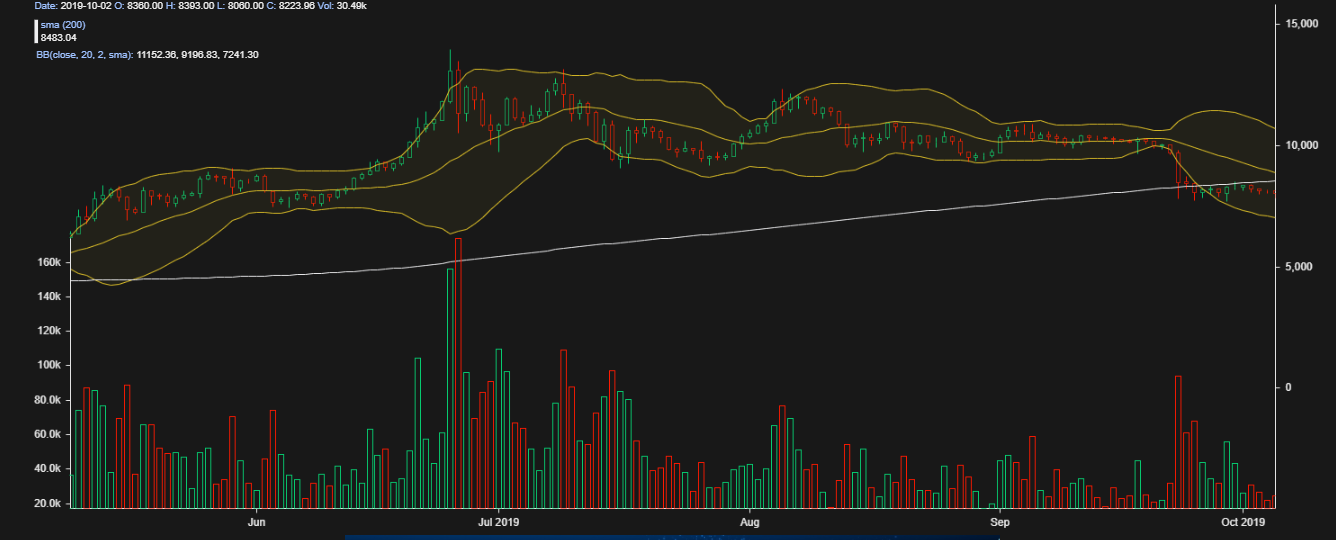
Japanese Candlestick images reflecting Offer’s Crows are not strong enough to push Demand’s Soldiers to a lower level than $8,000, though. Mathematical indicators, which are at their lowest possibility, could back a reversal movement to re-enter the action to the former battlefield between $9,000 and $12,000 when the bitcoin price turns back to the up side.
Volatility is high and it could swing the quotes up and down, keeping the trend in a bullish frame. We could evaluate an intermediate recovering target to reach and overcome at $9,000 — but if that level becomes a resistance, support would then be at $6,000.
What do you think will happen to the bitcoin price? Share your predictions in the comments below.
If you find Ramiro’s analyses interesting or helpful, you can find out more about how he comes to his conclusions by checking out his primer book, the Manual de Análisis Técnico Aplicado a los Mercados Bursátiles. The text covers the whole range of technical analysis concepts, from introductory to advanced and everything in between. To order, send an email to [email protected]

Images via Pixabay, Ramiro Burgos
This technical analysis is meant for informational purposes only. Bitsonline is not responsible for any gains or losses incurred while trading bitcoin.


