

Bitcoin price attempted a fresh increase above the $34,500. BTC could start a major downside correction if there is a close below the 100 hourly SMA.
- Bitcoin is still struggling to clear the $35,000 resistance.
- The price is trading above $34,200 and the 100 hourly Simple moving average.
- There is a key rising channel forming with support near $34,300 on the hourly chart of the BTC/USD pair (data feed from Kraken).
- The pair could decline sharply if there is a close below $34,000 and then $33,400.
Bitcoin Price Holds Key Support
Bitcoin price started another increase above the $34,200 resistance zone. BTC climbed higher toward the $35,000 resistance zone, but there was lack of momentum.
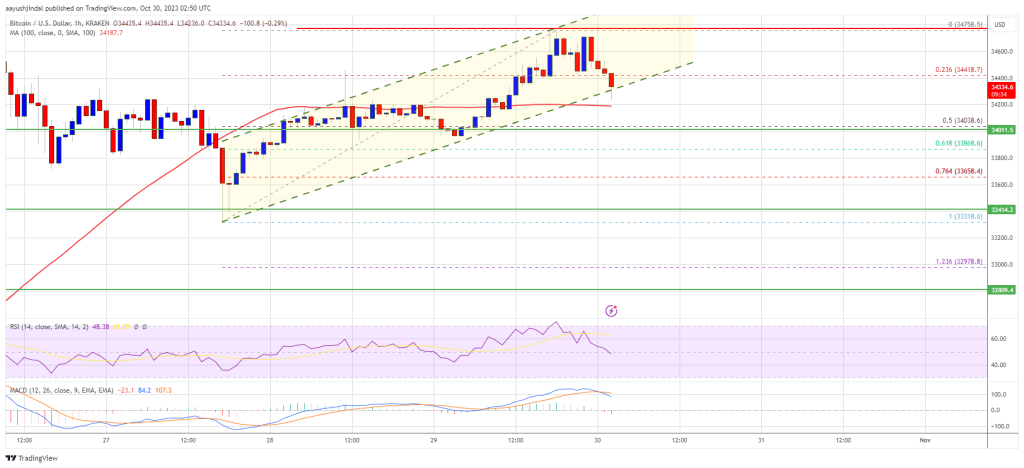
The price traded as high as $34,758 and struggled to continue higher. It is now correcting gains below the $34,500 level. There was a move below the 23.6% Fib retracement level of the upward move from the $33,318 swing low to the $34,758 high.
Bitcoin is now trading above $34,200 and the 100 hourly Simple moving average. There is also a key rising channel forming with support near $34,300 on the hourly chart of the BTC/USD pair.
On the upside, immediate resistance is near the $34,500 level. The next key resistance could be near $34,750 or the channel upper trend line. The main resistance is still near the $35,000 zone. A clear move above the $35,000 resistance might start another steady increase.
Source: BTCUSD on TradingView.com
The next key resistance could be $35,500, above which the price could test $36,200. Any more gains might send BTC toward the $36,500 level in the near term.
Downside Correction In BTC?
If Bitcoin fails to rise above the $34,750 resistance zone, it could start another decline. Immediate support on the downside is near the $34,200 level and the 100 hourly Simple moving average.
The next major support is near the $34,000 level or the 50% Fib retracement level of the upward move from the $33,318 swing low to the $34,758 high. If there is a move below $34,000, there is a risk of more downsides. In the stated case, the price could decline toward the $33,400 level or even $32,500.
Technical indicators:
Hourly MACD – The MACD is now losing pace in the bullish zone.
Hourly RSI (Relative Strength Index) – The RSI for BTC/USD is now below the 50 level.
Major Support Levels – $34,200, followed by $34,000.
Major Resistance Levels – $34,500, $34,750, and $35,000.


