

Bitcoin price has been in a strong uptrend since Black Thursday that turned fully parabolic in Q4, resulting in a new all-time high. But according to an analyst, the first-ever cryptocurrency is close to a breakdown of a parabolic curve that’s been supporting the upwards momentum for months.
Is this the end of the uptrend? Or is this just another touch of the parabolic support before blasting off to another level higher?
Bitcoin Goes Parabolic In 2020, What’s To Come In The New Year?
Bitcoin price is $1,000 below its 2020 peak, but clinging onto support ahead of the arrival of the new year. The leading cryptocurrency by market cap is the standout investment of the year, bringing positive portfolio performance amidst the backdrop of economic uncertainty and a dying dollar.
The perfect storm for the cryptocurrency was combined with institutions suddenly realizing the asset’s potential as a store of value and hedge against inflation.
Related Reading | Christmas Day Derivatives Expiry Could Deliver The Gift Of Dangerous Bitcoin Volatility
The surge of FOMO from high-wealth buyers has propelled Bitcoin to where it currently is, causing support to take on a parabolic shape.
Each correction was bought with such fury over the last few months, the price action has nearly gone straight upwards, which could result in the parabolic curve breaking down for the first time according to one crypto analyst.
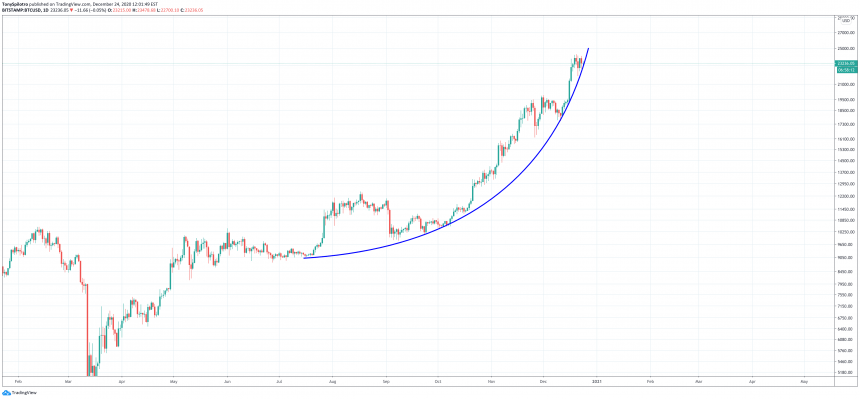
Bitcoin's parabolic curve could be ready to break down | Source: BTCUSD on TradingView.com
Correction Incoming, Or Does Crypto Volatility Go Vertical?
Bitcoin’s uptrend began either in December 2019 or on Black Thursday, depending on how you look at it. The black swan event was an anomaly, and the crypto asset kept climbing directly thereafter.
If anything, it caused the greatest buying opportunity in the asset’s history, resulting in a 500% ROI in just one year.
But the parabolic curve breaking down, could lead to a temporarily bearish phase – or it just as easily could cause the asset to keep on climbing higher in an upward trajectory.
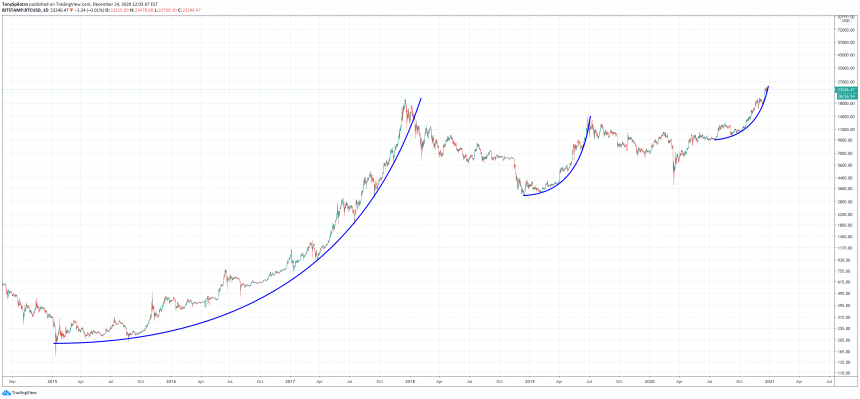
Past parabolic curves for comparison's sake | Source: BTCUSD on TradingView.com
Past instances of parabolic curves show both conclusions. In 2016, the parabolic curve kept going, while in 2019 it broke down resulting in several more months of a bear market.
Another parabolic shape could be losing support now, but which scenario will it come next? Considering how strong the uptrend has been with very little correction, a short-term trend change is possible and doesn’t mean the long-term uptrend is a lost cause if prices drop from here.
Related Reading | Bitcoin Dominance In December: Why The Future Of Altcoins Hinge On This Month’s Close
Just like Black Thursday, shakeouts attract new investors, allowing price to increase in a healthy way. When assets climb too quickly, selloffs get equally as nasty.
For now, continue to watch how price action takes shape, pun intended.
Featured image from Deposit Photos, Charts from TradingView.com


