

After a week of moving sideways, the Bitcoin price is finally experiencing some action; bulls are pushing for the most immediate critical resistance. The increasing uncertainty in the macroeconomic landscape supports the spike in price action, but optimist operators might have been too fast at jumping to their positions.
As of this writing, Bitcoin trades at $29,700 with sideways movement in the last 24 hours and a 2% profit over the past week. Other cryptocurrencies in the top 10 are experiencing similar price action, but Solana stands out with a 6% profit on similar timeframes.
Why Is The Bitcoin Price Up Today, But Could Be Down Tomorrow
All eyes are set on tomorrow’s US Consumer Price Index (CPI) data, the proxy to gauge inflation in this country’s fiat currency. A recent report highlights positive expectations for this event, as most investors expect inflation to continue its decline.
This might allow the Federal Reserve (Fed) to slow down on its interest rates hike program, finally giving Bitcoin room to break and flip $30,000 into support. However, the report notes that any surprises could trigger the opposite effect.
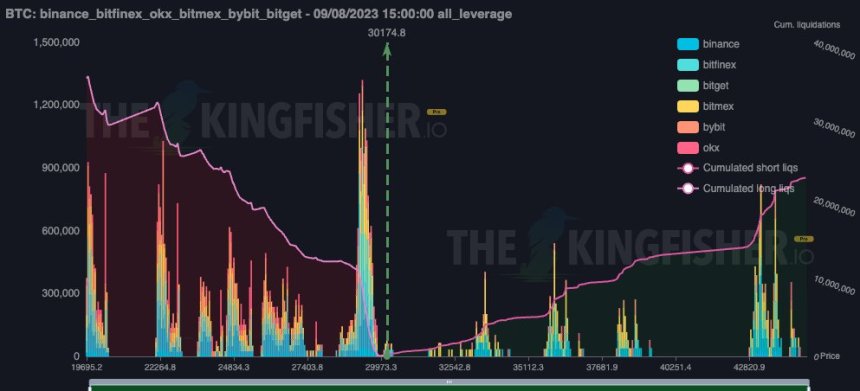
In this scenario, data from crypto analyst firm The King Fisher shows a concentration of long liquidity sitting between the $27,000 to $29,000 levels. As seen in the chart below, this liquidity could operate as a magnet erasing BTC’s gain and pushing it into support.
Conversely, positive CPI data could have little to no impact on BTC, allowing it to continue in its current range. As NewsBTC
Analyst Keith Alan from Material Indicators believes Bitcoin bulls are fighting to regain control over the 50-day moving average (MA). While the analyst expects bullish momentum could weaken, a push into the region around $30,200 to $30,000 is likely. Alan stated:
That doesn’t mean we can’t see a push to the $30.2k – $30.5k range today. In fact I think there’s a good chance we could see that, and if we do, I’ll take some more profit on my scalp. What I’m watching for is where we close today and were bid liquidity comes in as local support.
Cover image from Unsplash, chart from Tradingview


