On-chain data shows Bitcoin has recently made a break that led to rallies of at least 99% during the last three times it happened.
Bitcoin Has Now Crossed Above “Single Cycle HODLers” Cost Basis
In a new post on X, analyst Ali has talked about a level that BTC has broken recently. The level in question is the cost basis of the single-cycle Bitcoin long-term holders. The terms may be unfamiliar, so here’s what they mean, one by one.
First, the “long-term holders” (LTHs) here refer to the investors who have been holding onto their coins since at least 155 days ago. The LTHs are made up of the resolute diamond hands or HODLers, who rarely sell even when volatility occurs in the market.
Next, the “single cycle HODLers” specifically refer to those LTHs who bought within the span of a single BTC cycle. Their range is typically taken to be 6 months to 3 years. This means that the oldest among these investors (with coins aged 3 years) would have gone through the entire chaos of the current cycle, from the highs of the 2021 bull to the lows of the 2022 bear.
Lastly, “cost basis” refers to the average buying price of a group of Bitcoin investors. If the spot price of the cryptocurrency is trading below this value, it means that the cohort in question is in a state of net loss. Similarly, the asset being above implies the dominance of profits.
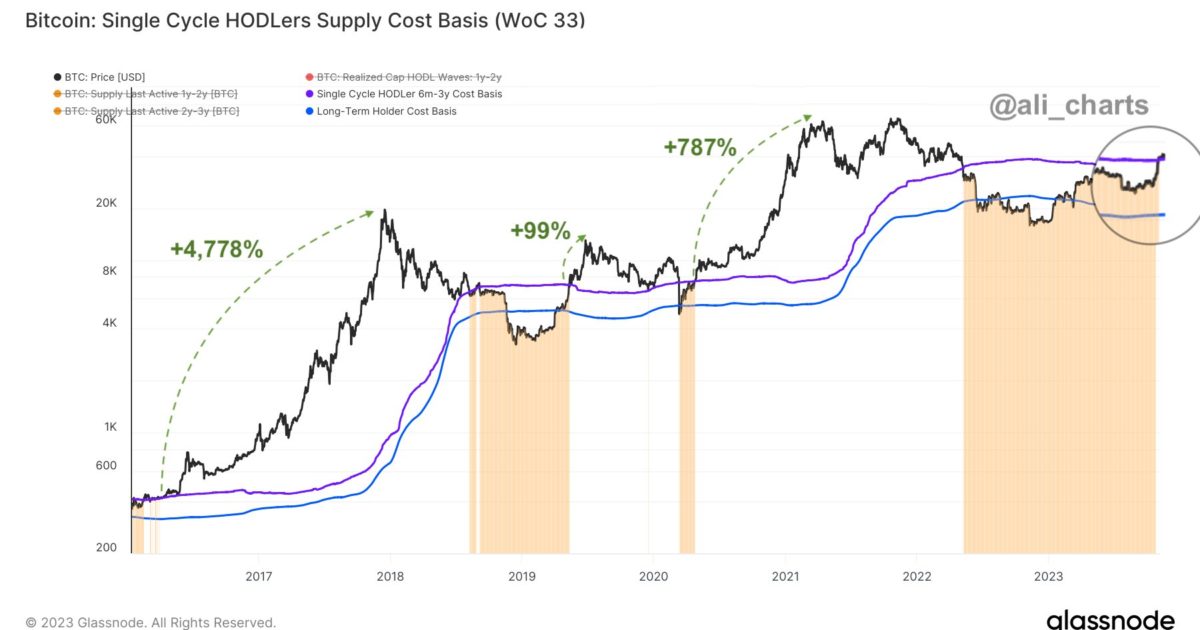
Now, here is a chart that shows the trend in the cost basis of the single-cycle LTHs over the past few years:
Looks like the price of the asset has interacted with this level in recent days | Source: Glassnode on X
Currently, this metric has a value of $34,150, which means that Bitcoin has already surged above it with the latest rally. This means that the average single cycle HODLer who had been in losses since the first half of 2022 has now finally returned to profits.
In the graph, Ali has also highlighted the trajectory that BTC followed during the last three times a break above this level took place. It would appear that each of the last two major bull rallies occurred after the breaks that took place in 2016 and 2020, respectively.
From the point of this breach, the cryptocurrency enjoyed returns of 4,778% and 787% over the course of the respective rallies. The recovery rally that started in April 2019 also observed a break of this cost basis, following which BTC registered gains of 99%.
If this pattern of the single cycle HODLer cost basis paving the way for a Bitcoin rally is anything to go by, then the asset could potentially see a surge now that it has once again broken above it.
As Bitcoin’s current rally is most similar to the April 2019 recovery rally, it’s possible that, if a surge does take place, it would be more in line with this rally, rather than the full-blown bull runs.
BTC Price
Bitcoin has gone silent recently as it has only registered gains of 2% in the past week, with the price now floating above $35,200.
BTC has been stuck in consolidation recently | Source: BTCUSD on TradingView
Featured image from Shutterstock.com, charts from TradingView.com, Glassnode.com


