

Bitcoin price jumped above the $9,550 resistance to invalidate a key head and shoulders pattern against the US Dollar. It seems like BTC is primed for a massive rally above $10,000.
- Bitcoin bears failed to push the price below the main $9,150 support against the US Dollar.
- The bulls gained control, resulting in a fresh increase above $9,500.
- There is a connecting bullish trend line forming with support near $9,280 on the hourly chart of the BTC/USD pair (data feed from Kraken).
- On the upside, the $9,500 and $9,580 levels hold the key for the next major rally.
Bitcoin Stuck In a Range
In yesterday’s weekly analysis, we saw a possible head and shoulders pattern for bitcoin below $9,500 against the US Dollar. BTC declined below $9,300, but the bears failed to push the price below the main $9,150 support.
As a result, the bulls regained control and pumped the price back above $9,400. Moreover, the price broke the $9,500 resistance and the 100 hourly simple moving average.
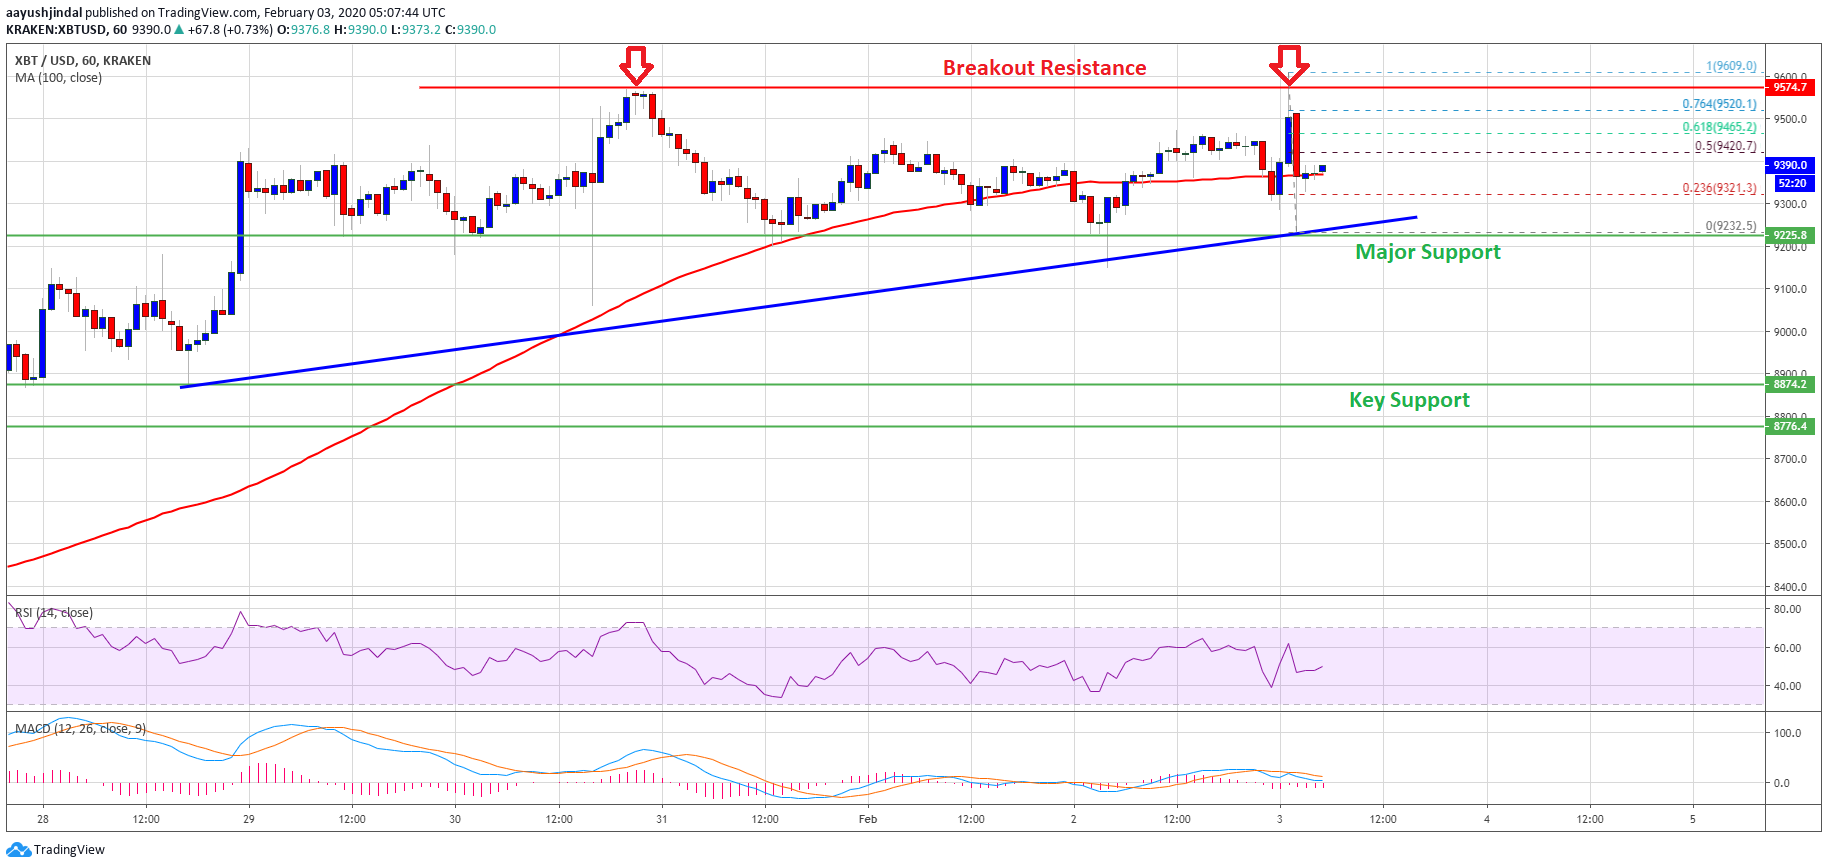
A new 2020 high is formed near $9,609 before the price trimmed gains. It revisited the $9,250 area and a low is formed near $9,232. Bitcoin is currently climbing higher and trading above the 23.3% Fib retracement level of the recent drop from the $9,609 high to $9,232 low.
Besides, there is a connecting bullish trend line forming with support near $9,280 on the hourly chart of the BTC/USD pair. Therefore, it seems like the price is well supported on the downside near the $9,280 and $9,240 levels.
The main support is still near the $9,150 level, below which there is a risk of a larger downside correction to $8,800 or even $8,600.
Major Hurdle for BTC
The $9,500 and $9,550 resistance levels are very important. A successful close above the mentioned levels is must for upside continuation towards the $10,000 resistance area.
Any further gains above the $10,000 handle may perhaps lead the price towards the $10,400 resistance level in the coming sessions. Conversely, if bitcoin continues to struggle near the $9,500 and $9,550 resistance levels, there is a risk of a strong decline below the $9,240 and $9,150 support levels in the near term.
Technical indicators:
Hourly MACD – The MACD is likely to move back into the bullish zone.
Hourly RSI (Relative Strength Index) – The RSI for BTC/USD is currently rising and it is just above the 50 level.
Major Support Levels – $9,240 followed by $9,150.
Major Resistance Levels – $9,500, $9,550 and $10,000.


