
Bitcoin’s block reward halving may be just hours away, two hours away by most estimates, but that hasn’t stopped the price from dumping.
The cryptocurrency just slid as low as $8,380 just minutes ago, visiting the levels it was trading at just 24 hours ago.
This came after Bitcoin rallied as high as $9,200 on Monday morning, seemingly responding to the hype around the imminent halving and a Paul Tudor Jones CNBC segment on Bitcoin. This meant that BTC sustained a drop of 9%.
Bitcoin price chart of May 9 to today from TradingView.com
Once again, some traders were caught off guard by this drop lower.
As can be seen in the chart below from Skew.com, approximately $20 million worth of BitMEX long positions were liquidated in this “flush” lower. This is far below the $230 million liquidated on Sunday, when BTC crashed from $9,700 to $8,100 within the span of an hour.
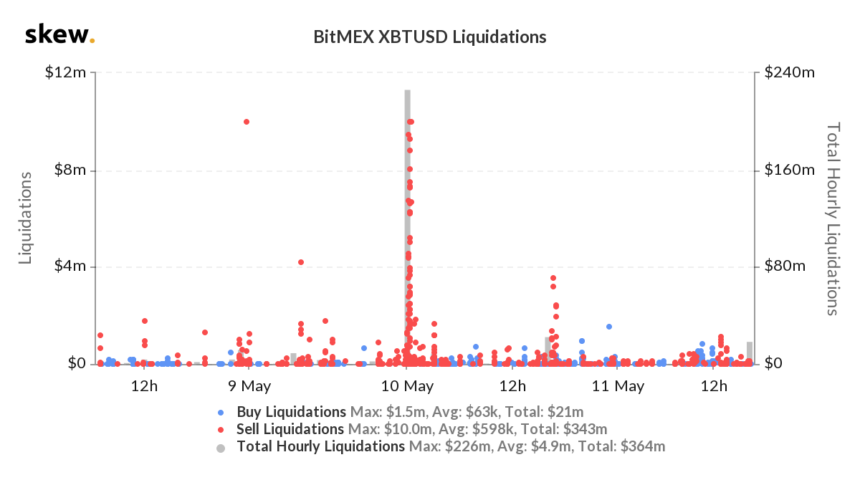
Chart of Bitcoin liquidations from Skew.com
According to Joe McCann, an AI and cloud specialist at Microsoft and a popular crypto trader, the funding rate seen when the price crash indicates that ~$8,380 was the bottom of that dump.
Expect Volatility as Bitcoin Halving Plays Out
This volatility is to be expected.
One trader noted that we should “[expect] high volatility in both directions in May.”
This point was not expanded upon but during and around the times of previous halvings, the crypto market was subject to volatility from a short-term time frame.
Below is a chart of Bitcoin’s price action before, during, and after the 2016 halving. As can be seen, below, the crypto asset rallied strongly into the halving, sold-off by 15% two weeks out, flatlined, then crashed four weeks later by 30% in three days.
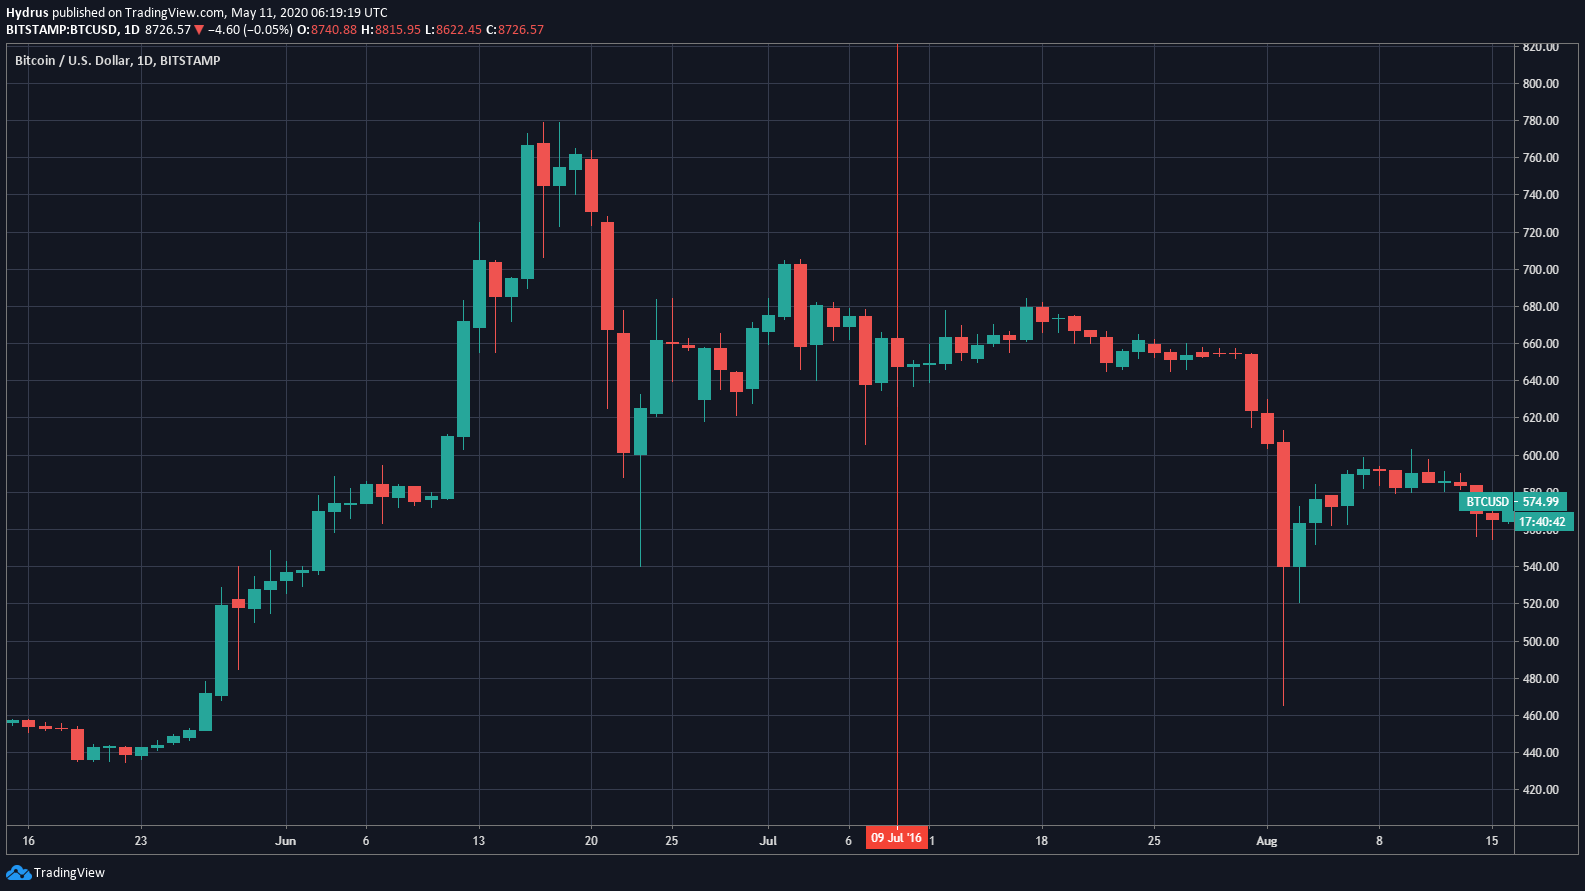
Chart of Bitcoin’s price action before, during, and after the last halving in 2016 from TradingView.com. The red line on the chart indicates when the halving took place.
Although there is no guarantee the same scenario will play out again, the chance that there is both “FOMO” and a “buy the rumor, sell the news” event after the halving is highly possible.
Photo by Bob Oh on Unsplash


